Tuesday, March 8, 2022

More things you shouldn't do in SQL Server: Disabling Optimisation Phases

PLEASE DON'T DO THIS

In my last post I covered optimisation phases and we can view optimiser information by using Trace Flag 8675. The last post looked at the search(0) and search(1) phases and we saw how the optimiser improved the cost of the query by using both of the phases with the search(1) phase resulting in the better plan in terms of cost.

I mentioned in that post that the optimiser has another phase it can use, no surprise it's called search(2) also known as the full optimisation phase (yes that's the full optimisation phase of the full optimisation stage, still with me? Good!).

The full optimisation phase I suppose would normally be reserved for those beastly queries that the optimiser really has to get to work on, looking at you Entity Framework but we can force optimiser behaviour by using an undocumented trace flag 8677 which entirely skips the search(1) phase. 

Now it has to be said it's undocumented for a reason, the reason is that it's really not a good idea to do this. In fact enabling this trace flag is such a bad idea that it will probably cause no end of issues with query performance...so let's do it, but before we do let me add yet again that please don't do this! Disabling optimisation features is a really bad idea, just like we did in this post - the purpose for this demo is just to show that we can, and how dangerous it can get.

Right, on with the show...

DBCC TRACEON(3604, -1);

DBCC TRACEON(8675, -1); 

DBCC TRACEON(8677, -1); 

As in the last post I've enabled trace flags 3604 and 8675 and this time I've also enabled trace flag 8677. I'm going to run the following query as it won't be able to use the search(0) phase as it's only using two tables and the search(0) phase requires at least three tables in the query:

SELECT * FROM Person.Person per
INNER JOIN Sales.Customer cus ON cus.PersonID = per.BusinessEntityID
OPTION (RECOMPILE);

The last time we ran the query (or we can look at the estimated execution plan) the output was the following:

End of simplification, time: 0.002 net: 0.002 total: 0 net: 0.002

end exploration, tasks: 57 no total cost time: 0.001 net: 0.001 total: 0 net: 0.004

end search(1),  cost: 3.99696 tasks: 211 time: 0.002 net: 0.002 total: 0 net: 0.006

End of post optimization rewrite, time: 0 net: 0 total: 0 net: 0.006

End of query plan compilation, time: 0 net: 0 total: 0 net: 0.007

This time though because we've disabled the search(1) phase we get this instead:

End of simplification, time: 0 net: 0 total: 0 net: 0

end exploration, tasks: 57 no total cost time: 0 net: 0 total: 0 net: 0.001

end search(2),  cost: 3.99696 tasks: 211 time: 0.001 net: 0.001 total: 0 net: 0.002

End of post optimization rewrite, time: 0 net: 0 total: 0 net: 0.002

End of query plan compilation, time: 0 net: 0 total: 0 net: 0.003

We can see the trace flag has worked, search(1) has been skipped and instead it has used the search(2) optimisation phase and apart from a very slight difference in compilation time the result is exactly the same which is no surprise as the search(2) phase contains all the transformation rules that can be used by the optimiser.

Let's try the query that is using three tables: 

SELECT * FROM Person.Person per
INNER JOIN Sales.Customer cus ON cus.PersonID = per.BusinessEntityID
INNER JOIN Sales.SalesOrderHeader soh ON soh.CustomerID = cus.CustomerID 
OPTION (RECOMPILE);

End of simplification, time: 0 net: 0 total: 0 net: 0

end exploration, tasks: 71 no total cost time: 0.001 net: 0.001 total: 0 net: 0.001

end search(0),  cost: 14.5642 tasks: 386 time: 0.001 net: 0.001 total: 0 net: 0.003

end exploration, tasks: 582 Cost = 14.5642 time: 0 net: 0 total: 0 net: 0.003

end search(2),  cost: 6.57863 tasks: 1059 time: 0.002 net: 0.002 total: 0 net: 0.006

End of post optimization rewrite, time: 0 net: 0 total: 0 net: 0.006

End of query plan compilation, time: 0 net: 0 total: 0 net: 0.007

Again we see the same as the previous post, the optimiser has used two phases and we can see the cost improvement gained between the search(0) and this time the search(2) phase. But at this point I'm wondering that if we can skip search(1), can we disable the others as well?

Yes we can (insert evil laugh here).

Trace flag 8677 also some, 8670 to skip search(2) and 8750 to skip search(0). Again, don't do this...ever!! Let's start with 8670:

DBCC TRACEON(8670, -1); 

As expected, because SQL won't even give me a warning, probably because it thinks nobody in their right mind would do this, the search(2) has been skipped which has resulted in a query that has a higher cost than if it could have used either search(1) or search(2):

End of simplification, time: 0.001 net: 0.001 total: 0 net: 0.001

end exploration, tasks: 71 no total cost time: 0.001 net: 0.001 total: 0 net: 0.002

end search(0),  cost: 14.5642 tasks: 386 time: 0.001 net: 0.001 total: 0 net: 0.003

End of post optimization rewrite, time: 0 net: 0 total: 0 net: 0.004

End of query plan compilation, time: 0.001 net: 0.001 total: 0 net: 0.006

So what happens if we disable search(0) I can hear you asking?? 

DBCC TRACEON(8750, -1); 

And when I try to run the query again:

Msg 8624, Level 16, State 1, Line 8
Internal Query Processor Error: The query processor could not produce a query plan. For more information, contact Customer Support Services.

Well it seems we've broken it (you notice I've used "we've" there) - query optimisation has essentially been disabled, as we say in Yorkshire, it's well and truly knackered.

If anything it's shown how easy it can be to enable a couple of undocumented things and cause no end of problems and a SQL Server that isn't working any more. Interestingly enough even if I remove the OPTION (RECOMPILE) which should retrieve the query from cache I still get the error. In order to set things right in the universe I'll quickly disable those trace flags again:

DBCC TRACEOFF(8677, -1); 
DBCC TRACEOFF(8670, -1); 
DBCC TRACEOFF(8750, -1);
DBCC TRACEOFF(8675, -1); 
DBCC TRACEOFF(3604, -1);

Watching Optimisation Phases with Trace Flag 8675

When a query is executed a few things happen; the query is parsed, a logical tree of the query is created, the query is simplified and then the optimiser determines if a trivial plan can be used. If a trivial plan can't be used, essentially if the optimiser has to figure out the optimal execution plan (such as making decisions on joins) then the query is passed to the full optimisation stage.

The full optimisation stage is where the optimiser uses a bag of tricks to optimise our query (surprise, surpise), well technically it has three bags of tricks that are named optimisation phases that each contain a collection of transformation rules (which I cover in this post that you should never do). The optimiser is not limited to using just one of the phases and each has a set criteria which determines if the optimiser can use that particular phase.

In order to see what how the optimiser is using these phases we need to enable Trace Flag 8675 as well as Trace Flag 3604 which will redirect the output to the query messages tab in Management Studio:

DBCC TRACEON(8675, -1); 

DBCC TRACEON(3604, -1);

Let's start with a very straightforward query on the AdventureWorks2019 sample database and for each of the queries we can actually run them or show the estimated execution plan which will still use the query optimisation process:

SELECT * FROM Person.Person OPTION (RECOMPILE);

Which when I check the output in the messages tab I can the following:

End of simplification, time: 0 net: 0 total: 0 net: 0

End of post optimization rewrite, time: 0 net: 0 total: 0 net: 0.001

End of query plan compilation, time: 0 net: 0 total: 0 net: 0.001

For this query we don't see any information relating to optimisation phases, that's expected because for this query the optimiser has used a trivial plan, which we can check in the plan properties:


If we re-run the query excluding the OPTION (RECOMPLILE) and again check the messages tab we don't see anything in the messages tab this time. This is because the query has been retrieved from the plan cache or procedure cache as it is also known. 

Now I'll add a join to the query to give the optimiser something to think about and use the RECOMPILE option to ensure the query is not retrieved from cache:

SELECT * FROM Person.Person per
INNER JOIN Sales.Customer cus ON cus.PersonID = per.BusinessEntityID
OPTION (RECOMPILE);

This time in the messages output we can see a line for search(1) which is also knowns as the Quick Plan optimisation phase:

End of simplification, time: 0.002 net: 0.002 total: 0 net: 0.002

end exploration, tasks: 57 no total cost time: 0.001 net: 0.001 total: 0 net: 0.004

end search(1),  cost: 3.99696 tasks: 211 time: 0.002 net: 0.002 total: 0 net: 0.006

End of post optimization rewrite, time: 0 net: 0 total: 0 net: 0.006

End of query plan compilation, time: 0 net: 0 total: 0 net: 0.007

Here we can see that the optimiser has produced an execution plan with a cost of 3.9969 and I can check that against either the estimated or actual plan in management studio by hovering over the left most operator (in this case the Select) and checking the Subtree cost, the below image is from the estimated plan showing the estimated cost to be 3.99696


In order to demonstrate the optimiser using multiple phases I'll add a join to another table. There is another optimisation phase, search(0) named Transaction Processing where the transformation rules are used for OLTP type queries. The optimiser didn't start with search(0) for our previous query because there has to be at least three tables used in the query in order for the optimiser to use this particular phase.

SELECT * FROM Person.Person per
INNER JOIN Sales.Customer cus ON cus.PersonID = per.BusinessEntityID
INNER JOIN Sales.SalesOrderHeader soh ON soh.CustomerID = cus.CustomerID 
OPTION (RECOMPILE);

Again using the RECOMPILE this time we're using three tables in the query (Person.Person, Sales.Customer and Sales.SalesOrderHeader) and if we look at the message output after the query has executed we can see the use of two optimisation phases; search(0) and search(1) and corresponding time that the optimiser has spent in each phase:

End of simplification, time: 0.004 net: 0.004 total: 0 net: 0.004

end exploration, tasks: 71 no total cost time: 0.005 net: 0.005 total: 0 net: 0.01

end search(0),  cost: 14.5642 tasks: 386 time: 0.008 net: 0.008 total: 0 net: 0.018

end exploration, tasks: 572 Cost = 14.5642 time: 0.002 net: 0.002 total: 0 net: 0.021

end search(1),  cost: 6.57863 tasks: 1027 time: 0.01 net: 0.01 total: 0 net: 0.031

End of post optimization rewrite, time: 0 net: 0 total: 0 net: 0.032

End of query plan compilation, time: 0.002 net: 0.002 total: 0 net: 0.035

The interesting thing here is the cost difference between the optimisation phases, the search(0) phase returned a query plan with a cost of 14.5642 however by using the search(1) phase the query has used a plan with an associated cost of 6.57863 which is a clear improvement.

There is another phase, stage(2) which is the full optimisation phase that contains every single transformation rule available. I'll cover that in a forthcoming post and in the meantime I'll write a horrible enough query to use that phase and we'll look into optimiser timeouts as well.

Trace Flag 8675 is one of those little known trace flags (IMO) that gives us some in-depth information on how the query optimiser is working. 

To finish off, to disable the trace flags I should now run the following: 

DBCC TRACEOFF(8675, -1); 

DBCC TRACEOFF(3604, -1);

Monday, March 7, 2022

Database offline worked fine, database online didn't!

I was browsing the SQL Server subreddit earlier where someone had posted a problem where they'd been able to take a database offline but couldn't bring the database back online via a script or the UI in SSMS (full thread here).

There's a bit of a back story; all the DBA's have left the business (facepalm) so a non-DBA has been left with the admin type tasks. Secondly the reason the database was being taken offline was to take physical backups of the databases mdf and ldf files (double facepalm).

Anyway, on the issue itself. My first thought was permissions, because it always is...or at least we can't blame DNS this time. But I had a slight doubt, surely if you had permissions to take a database offline you can bring it back?

Well, nope.

Being a member of the db_owner role will give you the required access to take a database offline. I'm going to test it on my machine as we go along:

CREATE LOGIN [supertester] WITH PASSWORD=N'MEG4PASSword.77', DEFAULT_DATABASE=[master], DEFAULT_LANGUAGE=[us_english], CHECK_EXPIRATION=OFF, CHECK_POLICY=OFF

GO

Then I'll change database context to my imaginatively named Test database and add the supertester user and add it to the db_owner role:

USE Test

GO

CREATE USER [supertester] FOR LOGIN [supertester];

EXEC sp_addrolemember N'db_owner', N'supertester';

I've logged into SSMS as the supertester login, the first thing I want to try is taking the database offline but I'm going to select to Drop All Active Connections:


I get the following error on VIEW SERVER STATE permissions being denied:


However, if I run the following T-SQL command the database successfully goes offline:

ALTER DATABASE Test SET OFFLINE WITH ROLLBACK IMMEDIATE; 

So, supertester has been able to offline the Test database, now to bring it back:

ALTER DATABASE Test SET ONLINE;

Unfortunately I'm greeted by the following red text:

Msg 5011, Level 14, State 9, Line 1

User does not have permission to alter database 'Test', the database does not exist, or the database is not in a state that allows access checks.

Msg 5069, Level 16, State 1, Line 1

ALTER DATABASE statement failed.

Oh dear...or words to that effect, db_owner role members can take databases offline but not bring the databases back online again. In this case it's going need elevated permissions, either ALTER ANY DATABASE being granted or maybe sysadmin role membership, especially if they're going to be taking on more admin type activities in the future.

The final note has to be about this whole scenario. I really feel for accidental/reluctant DBA's who are tasked (or rather thrown in to the deep end) with all kinds of activities without any support whatsoever. This is a perfect example where someone has been following instructions (admittedly they make no sense) without any real understanding and through no fault of their own has ended up in what could be a critical situation.

Yes, let's of people jumped into the thread to help which is awesome, and you know it's such a great thing about the SQL community that people are always willing to help but this is something that could have been avoided.

Finally I'll drop the supertester user and login because they're always up to no good.

Running a SQL Server Best Practice Assessment with PowerShell

My last post covered the SQL Assessment extension in Azure Data Studio and in this article I'm going to look at running the SQL Assessment API using PowerShell instead. Whilst in ADS we can export assessment results to HTML or into SQL via a script the PowerShell option is a bit more flexible, we can export straight to a SQL table and run the assessment across multiple instances.

I'll follow the PowerShell instructions from the SQL Assessment API web page; this is the code that will run the assessment on my localhost instance and it will also write the results to a table (Assessment.Results) in the SQLAssessmentDemo database, the -Force parameter will create the objects if they don't already exist:

Get-SqlInstance -ServerInstance 'localhost' |

Invoke-SqlAssessment -FlattenOutput |

Write-SqlTableData -ServerInstance 'localhost' -DatabaseName SQLAssessmentDemo -SchemaName Assessment -TableName Results -Force

If required we're not just limited to one instance, in the following script I can run the assessment against my default instance and a named instance (localhost\MSSQLSERVER01).

Get-SqlInstance -ServerInstance 'localhost', 'localhost\MSSQLSERVER01' |

Invoke-SqlAssessment -FlattenOutput |

Write-SqlTableData -ServerInstance 'localhost' -DatabaseName SQLAssessmentDemo -SchemaName Assessment -TableName Results -Force

But for added flexibility I can store the names of the SQL instances in a text file and loop through the content using the following:

$servers = Get-Content -Path C:\SQL\SQLServers.txt

ForEach ($server in $servers)

{

Get-SqlInstance -ServerInstance $server |

Invoke-SqlAssessment -FlattenOutput |

Write-SqlTableData -ServerInstance 'localhost' -DatabaseName SQLAssessmentDemo -SchemaName Assessment -TableName Results -Force

}

The scripts will export the assessment data into the specified table where the check information is stored, along with items such as a timestamp, the ruleset being used and the help link. One thing that is missing is the tag which is available in ADS which I think would be really useful when querying the data.

One column of note is the TargetType, in ADS when the assessment is ran it returns checks both the instance and each of the databases but in PowerShell the server and database assessments need to be ran as separate scripts, here's the database level one which is using Get-SqlDatabase as opposed to Get-SqlInstance:

$servers = Get-Content -Path C:\SQL\SQLServers.txt

ForEach ($server in $servers)

{

Get-SqlDatabase -ServerInstance $server |

Invoke-SqlAssessment -FlattenOutput |

Write-SqlTableData -ServerInstance 'localhost' -DatabaseName SQLAssessmentDemo -SchemaName Assessment -TableName Results -Force

}

And of course we can combine the server and database level scripts into one which will gather both sets of assessment results:

$servers = Get-Content -Path C:\SQL\SQLServers.txt

ForEach ($server in $servers)

{

Get-SqlInstance -ServerInstance $server |

Invoke-SqlAssessment -FlattenOutput |

Write-SqlTableData -ServerInstance 'localhost' -DatabaseName SQLAssessmentDemo -SchemaName Assessment -TableName Results -Force

Get-SqlDatabase -ServerInstance $server |

Invoke-SqlAssessment -FlattenOutput |

Write-SqlTableData -ServerInstance 'localhost' -DatabaseName SQLAssessmentDemo -SchemaName Assessment -TableName Results -Force

}

Now the data is stored in SQL we can look at the results, for my two instances I have 1213 rows of assessment data to look through which is a lot. To filter on which instance I return assessment results for I can use the TargetPath column (I'm having to double up on the single quotes to avoid a syntax error):

SELECT * FROM

[SQLAssessmentDemo].[Assessment].[Results]

WHERE TargetPath = 'Server[@Name=''DESKTOP-MFKSHR7'']'

If I wanted to filter on just the server level assessment items then I can use the following:

SELECT * FROM

[SQLAssessmentDemo].[Assessment].[Results]

WHERE TargetPath = 'Server[@Name=''DESKTOP-MFKSHR7'']'

AND TargetType = 'Server'

Filtering for groups of items is a little more difficult without the Tag column which is available in Azure Data Studio. As the assessment has a rule for individual SQL Agent alerts based on their severity then we need to use a LIKE clause to return all the relevant results:

SELECT * FROM

[SQLAssessmentDemo].[Assessment].[Results]

WHERE TargetPath = 'Server[@Name=''DESKTOP-MFKSHR7'']'

AND TargetType = 'Server'

AND CheckId LIKE 'AgentAlerts%'

The recommendation itself is stored in the Message column, here's the field content for the  AgentAlertsSeverity10 CheckId row (that's a lot of alerts):

Create alerts for errors: 825, 833, 855, 856, 3452, 3619, 17179, 17883, 17884, 17887, 17888, 17890, 28036

The chances are you have one than one database on an instance of SQL Server and the database name of each assessment rule is stored in the TargetType column, such as; Server[@Name='DESKTOP-MFKSHR7']/Database[@Name='WideWorldImporters']  and again we'd need to double quote when filtering on the value in SQL. The following query will return all the database assessment results for the WideWorldImporters database:

SELECT * FROM [SQLAssessmentDemo].[Assessment].[Results]

WHERE TargetType = 'Database' 

AND TargetPath = 'Server[@Name=''DESKTOP-MFKSHR7'']/Database[@Name=''WideWorldImporters'']'

Database checks are very comprehensive, particularly because of the amount of checks on indexes that might be deemed unnecessary, items such as unused or missing indexes should always be reviewed very carefully. 

As an example on the results on my instance (WorldWideImporters) is to revise the unused index [FK_Sales_Customers_PostalCityID]. If I went ahead and dropped the index it would then be picked up by the assessment rule that checks for Foreign Keys with no index (FKNoIndexes).

If we wanted to remove data from the SQL table prior to exporting then a straightforward TRUNCATE TABLE can be used before repopulating the data: TRUNCATE TABLE [SQLAssessmentDemo].[Assessment].[Results] but as a Timestamp column is also exported we can easily build an automated weekly process (such as scheduling the PowerShell script to run via SQL Agent) that will store a complete repository over time of the assessment results which can be filtered on the date to track the history.

This is the big advantage of the PowerShell approach, it's really straightforward to implement an automated best practice assessment of your SQL Server instances and having the data in SQL Server means the creative types can build visualisations on top of the data for funky things like dashboards. Worth noting the table isn't indexed in any fashion by default so you'll need to look into that for better performing queries.

It's worth adding that there are plenty of third party options for SQL Server assessments out there that are both paid for and open source. Having the SQL Assessment API available is another option to take a look at, the underlying JSON is customisable too if you wanted to tweak some of the settings, disable rules or add your own and with the simplicity of PowerShell and the ability of running the assessment over multiple instances is a big advantage for me.

Saturday, March 5, 2022

Exploring Azure Data Studio Extensions - SQL Assessment

Recently I've been spending more time using Azure Data Studio, for anyone not familiar with this tool you can read more about it here. The link has a handy comparison between Azure Data Studio (ADS) and SQL Server Management Studio (SSMS) and I have to admit whilst I do use SSMS for most things, ADS comes with lots of cool stuff, and who doesn't like cool stuff?

Cool stuff in ADS comes in the form of extensions. I was demoing the Azure SQL Migration extension in this recent post where I was looking at the recently added SKU recommendations for Azure migration targets. There are lots of other extensions available so I'm starting a few posts to take a look at the functionality they offer.

To begin with in this post I'm looking at the SQL Assessment extension which at the time of writing is in preview and is at version 0.6.1. The extension uses the SQL Assessment API (more about that here) to provide a best practice analyser for a SQL Servers configuration, you can read about using this with PowerShell in this post

To install the extension simply browse to the extension marketplace in ADS, select SQL Assessment and click install:

To use the extension right click an available connection in ADS and select Manage where SQL Assessment will be available under the General section:

This opens the SQL Assessment screen and there are two main options available that I want to demo, Invoke assessment and View applicable rules. Before I start an assessment I'll have a look at the rules to see the kind of things the assessment is looking for.


When it comes to the amount of rules, let's just say there's a lot (full list of rules here) and at first it's showing the rules that apply to various trace flags in SQL Server that can be enabled and by clicking each item a handy description is displayed underneath the rule window (apologies for the image format btw):


Each rule uses tags to indicate the area of SQL Server that the rule applies to, here the rule is checking TF 174 (increases plan cache bucket count) and the relevant Tags are TraceFlag (naturally), Memory and Performance and we can filter the view for specific tags by clicking the down arrow on the Tags menu bar:


Looking through each of the tags and rules will take a lifetime so let's get on with running the assessment on my local test instance; to do that just click Invoke assessment on the menu bar and the view quickly starts to fill up with messages! In total the assessment took just under a minute to run on my instance.

It would have been nice to have a visual summary at this point, perhaps showing a total of warnings/issues that the analyser picked up and broken down per database (as the HTML report does which I'll mention shortly) but I can filter on target (instance/database) as well severity and select to show just information or warnings. Edit: You can use the History tab to view number of Errors, Warnings and Information checks per assessment.


On my laptop screen the results pane is a little bit cramped:


Fortunately though there are two export options available either to HTML where you specify a local file which handily opens in a browser straight from ADS or export as a SQL script where the results can be loaded into a SQL table.

The HTML report is organised really well; the instance level items are first which are followed by the database level items and it's very concise! It includes some of the usual suspects for creating SQL Agent alerts, although I have to add, that's a lot of alerts:

Create alerts for errors: 825, 833, 855, 856, 3452, 3619, 17179, 17883, 17884, 17887, 17888, 17890, 28036
Create alerts for errors: 2508, 2511, 3271, 5228, 5229, 5242, 5243, 5250, 5901, 17130, 17300
Create alerts for errors: 802, 845, 1101, 1105, 1121, 1214, 8642, 9002
Create alerts for errors: 701
Create alerts for errors: 3624
Create alerts for errors: 605
Create alerts for errors: 5180, 8966
Create alerts for errors: 5572, 9100
Create alerts for errors: 823, 824, 832

And items such as Optimize for ad hoc workloads (which everyone was advised to do before this post came along from Erik Darling) - the percentage of single use plans currently in the plan cache (65%) is nice to see.

Enable 'Optimize for ad hoc workloads' setting on heavy OLTP ad-hoc workloads to conserve resources. Current amount of single use plans in cache is high (65%)

That post does raise a very important point; whilst the assessment tool provides a very in-depth exploration of your SQL Server and will raise lots of different potential tweaks just doing them all without understanding the impact could well be a recipe for disaster (though each rule does come with a Learn More link for further research).

Database rules go a little deeper. As well as checking things like the last DBCC CHECKDB, transaction log backups and compatibility levels there are a lot of index level checks such as tables with no index (CheckID = TableNoIndex) and foreign keys without indexes (FKNoIndexes) as well as checks for redundant and rarely used indexes (incidentally the Learn More link for these rules takes you to the DROP INDEX page which to me seems a little final!). 

There's also checks everyone's favourite debatable subject index fragmentation and I assume by the optimisers missing index recommendations a MissedIndex check as well - again these definitely should come with the warning not to blindly follow the advice. BTW a nice addition would be a rule for a duplicate index check.

I'm not going to cover the export as script option from ADS in this post, whilst I think it's a nice feature I think using the SQL Assessment API with PowerShell is a much easier way to export the results to a SQL table and I'll definitely cover that in a forthcoming post.

So to summarise; the SQL Assessment extension is a fantastic addition to ADS and provides a very concise assessment of how your SQL Server and databases are setup, configured and utilised. Yes, there's a lot of rules that will get flagged that are up for debate and some of the recommendations could be perhaps viewed as overkill, or maybe even a bad idea! As always the "rule" is not to blindly go implementing the advice and start changing settings or removing indexes for example and look further into the recommendations and use your own measured judgement.

Friday, March 4, 2022

Azure SQL Managed Instance - Configure Managed Instance Disabled

Quick post on an issue I encountered earlier when trying to create a new Azure SQL Managed Instance on a brand new Azure subscription. Unfortunately I can't recreate the problem as I fixed it manually and things have worked as expected ever since so you'll have to take my word for it!

The problem I had when creating a new SQL Managed Instance was that the Configure Managed Instance was disabled (the following image shows what it should look like) and I wanted to reduce the compute of the new managed instance:

What I also found on the following Networking screen was that the Virtual network/subnet option was stuck at loading and this needs to be complete to allow configuration of the Managed Instance, in fact it won't even create the resource without this option completed:


To resolve the issue I had to create a brand Virtual Network resource in the Portal which I could then select from the dropdown list when I tried to create a Managed SQL Instance again. I then deleted the new Virtual Network and went back to see if the problem would reoccur and was correctly given the new option as shown in the image above.

So if you are creating this type of resource with no Virtual Network you might run into this problem and would need to create the Virtual Network first! Not sure if anyone else has ran into this?!

Azure Data Studio - Azure SQL Migration Extension SKU Recommendations

Microsoft recently announced the Public Preview of SKU recommendations in the Azure SQL Migration extension in Azure Data Studio. This enables us to use a performance assessment on our databases to provide us with correct sizing for an Azure SQL Managed Instance (or Azure SQL VM).

I'm using the latest version, 1.35.0 which you can download from here and if you're wondering what Azure Data Studio is, you can find out more information from this link.

The Azure SQL Migration extension is available to install via the extensions marketplace:


To perform a migration you will need Azure account details but if you're just performing an assessment like we are in this post then they're not required. Once installed we use the Manage option on an available connection as follows:


This opens up a new screen which shows some basic information about the selected SQL instance, under General the Azure SQL Migration option will now be available:


This will open the Azure SQL Migration screen, one of the things I love about Azure Data Studio is its interactivity options; we can link an Azure account from here, view migration tutorials and even open a support request but for now we'll proceed with the assessment process:


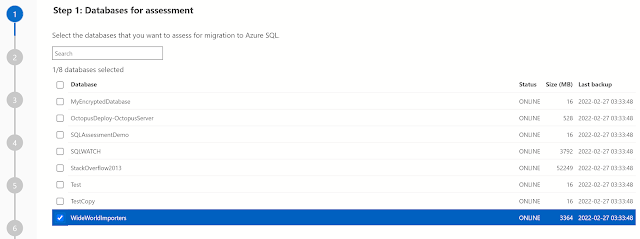
We'll now be presented with the databases on our selected instance that we wish to assess for migration, I've selected the WideWorldImporters sample database:


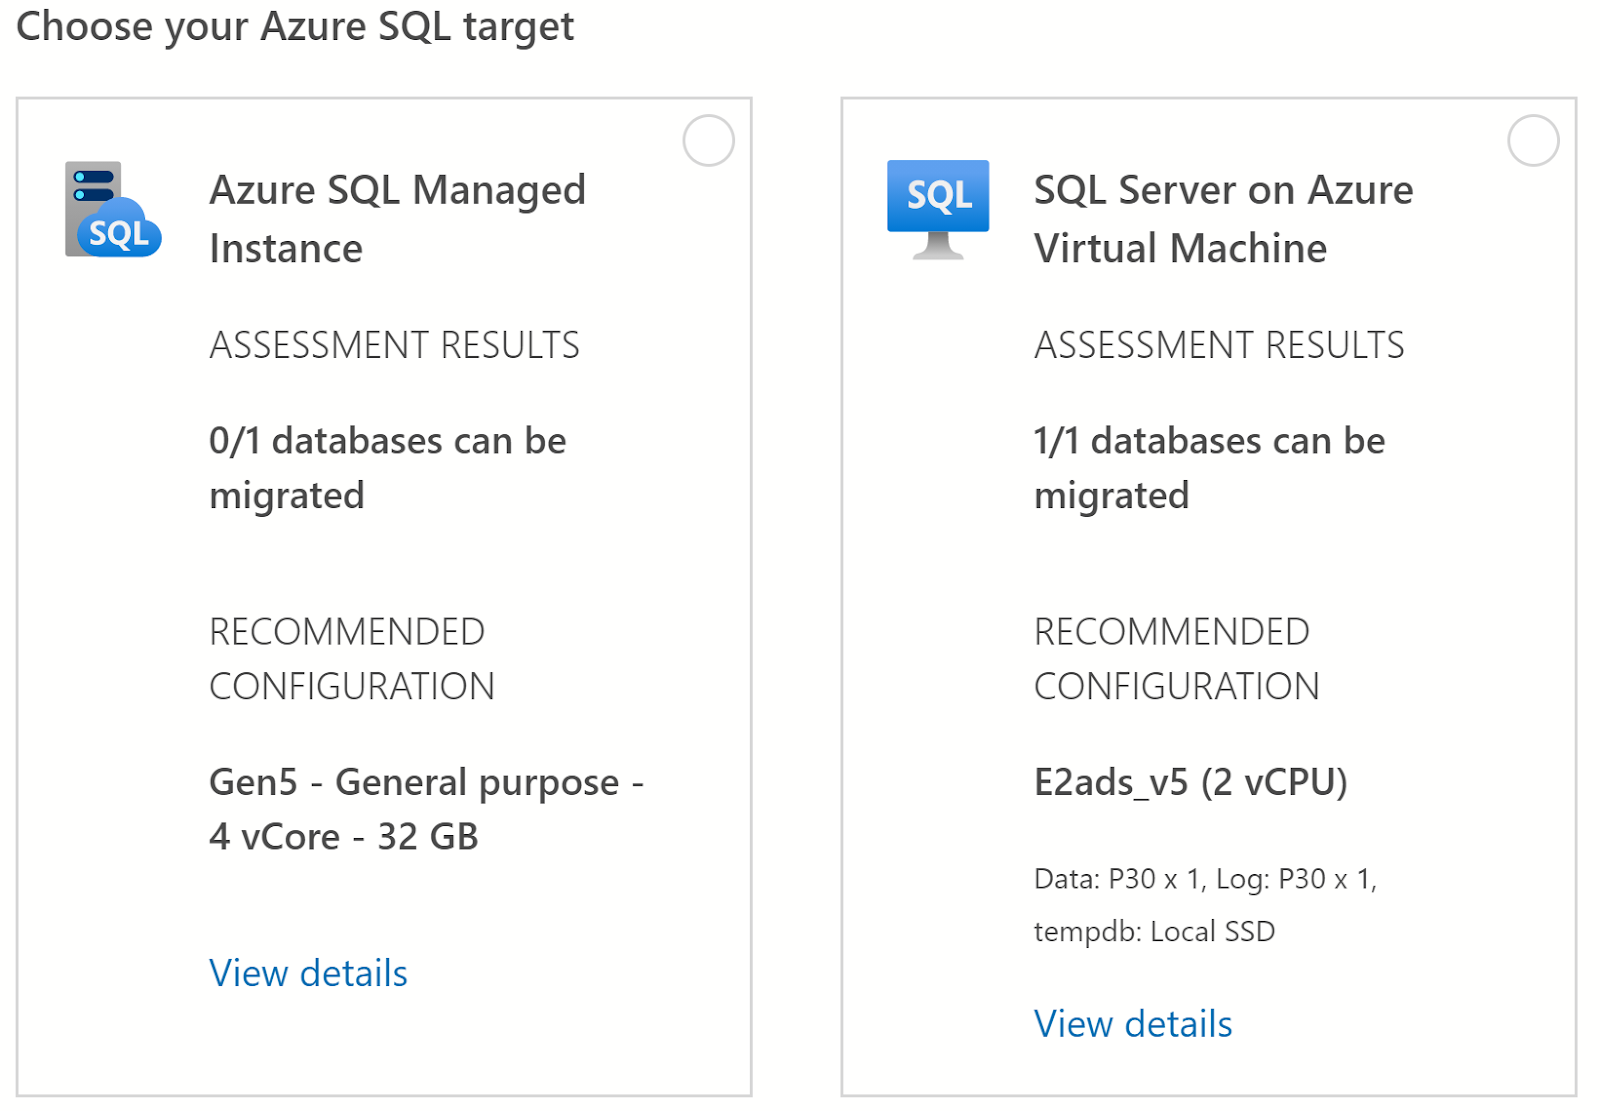
On the next screen we can see two migration options; Azure SQL Managed Instance and SQL Server on Azure Virtual Machine, at the bottom of the screen we'll click Get Azure Recommendation to start the performance data collection, as I haven't previously ran the collector I'll select Collect performance data now and specify a local folder where the data will be saved (once collected I can use the "I already have the performance data" option at a later time).


The data collector will run for about 10 minutes. It's worth mentioning that to be as accurate as possible the collector should be ran on "real life" workloads, if you run the collector during periods of low activity then the chances are the recommendations will be for a lower specification than what you might actually require in Azure. 


Once the data collection has completed the recommendations are automatically refreshed under each of the migration targets. In this case for Azure SQL Managed Instance it has recommended the Gen5 General Purpose 4 vCore option (32 GB) and for SQL Server on Azure Virtual Machine the E2ads_v5 2 vCPU option. 


But...

Under the Azure SQL Managed Instance option the assessment results show that 0/1 databases can be migrated. To see any issues I need to select the Managed Instance option and click Next (if you don't select a target you'll get a nice red banner telling you off).

I expected to go the the next screen but actually I couldn't and instead had to select a database and it's assessment button from this button at the bottom of the screen (in truth I found it a bit fiddly, but never mind):


The next screen shows that I have a potential migration issue on the WideWorldImporters database, I can select the database using the checkbox next to it to view the relevant information: 


Here's the problem:


In terms of performance data the recommendation is for the General Purpose service tier of Azure SQL Managed Instance however as the WideWorldImporters database makes use of in-memory tables these are not supported and is actually only supported on the Business Critical service tier.

But that's the whole point of a migration assessment tool, not only does the extension gauge database performance and recommend the correct SKU it also identifies potential migration issues such as unsupported functionality, and without a doubt the more you know beforehand the better!

Breaking up with SQL Server

I was inspired to write this after reading a post from Dave Mason regarding breaking up with Big Tech companies. Yet again I haven't wr...