Showing posts with label sqlserver. Show all posts

Friday, March 4, 2022

Azure Data Studio - Azure SQL Migration Extension SKU Recommendations

Microsoft recently announced the Public Preview of SKU recommendations in the Azure SQL Migration extension in Azure Data Studio. This enables us to use a performance assessment on our databases to provide us with correct sizing for an Azure SQL Managed Instance (or Azure SQL VM).

I'm using the latest version, 1.35.0 which you can download from here and if you're wondering what Azure Data Studio is, you can find out more information from this link.

The Azure SQL Migration extension is available to install via the extensions marketplace:


To perform a migration you will need Azure account details but if you're just performing an assessment like we are in this post then they're not required. Once installed we use the Manage option on an available connection as follows:


This opens up a new screen which shows some basic information about the selected SQL instance, under General the Azure SQL Migration option will now be available:


This will open the Azure SQL Migration screen, one of the things I love about Azure Data Studio is its interactivity options; we can link an Azure account from here, view migration tutorials and even open a support request but for now we'll proceed with the assessment process:


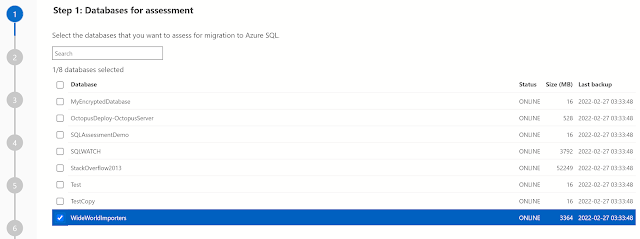
We'll now be presented with the databases on our selected instance that we wish to assess for migration, I've selected the WideWorldImporters sample database:


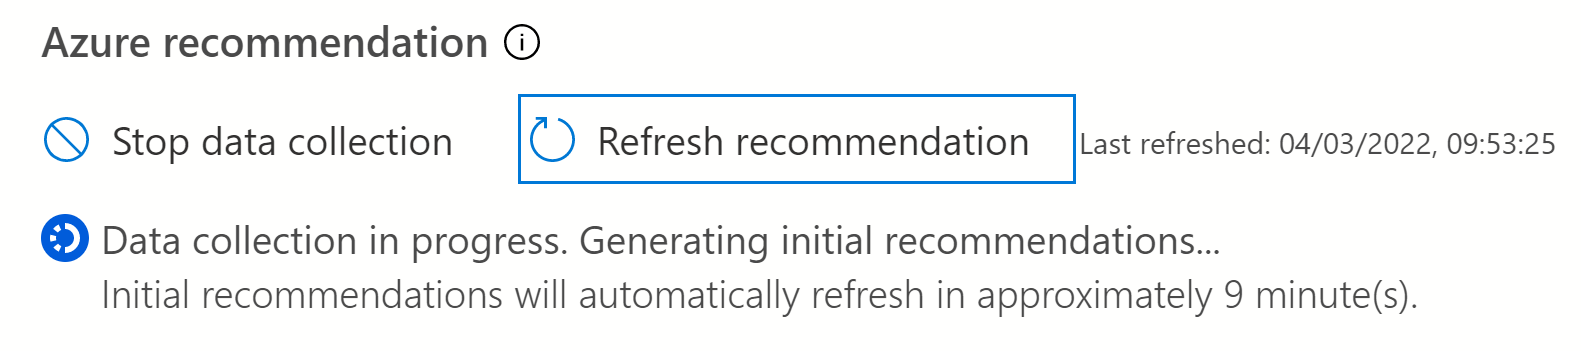
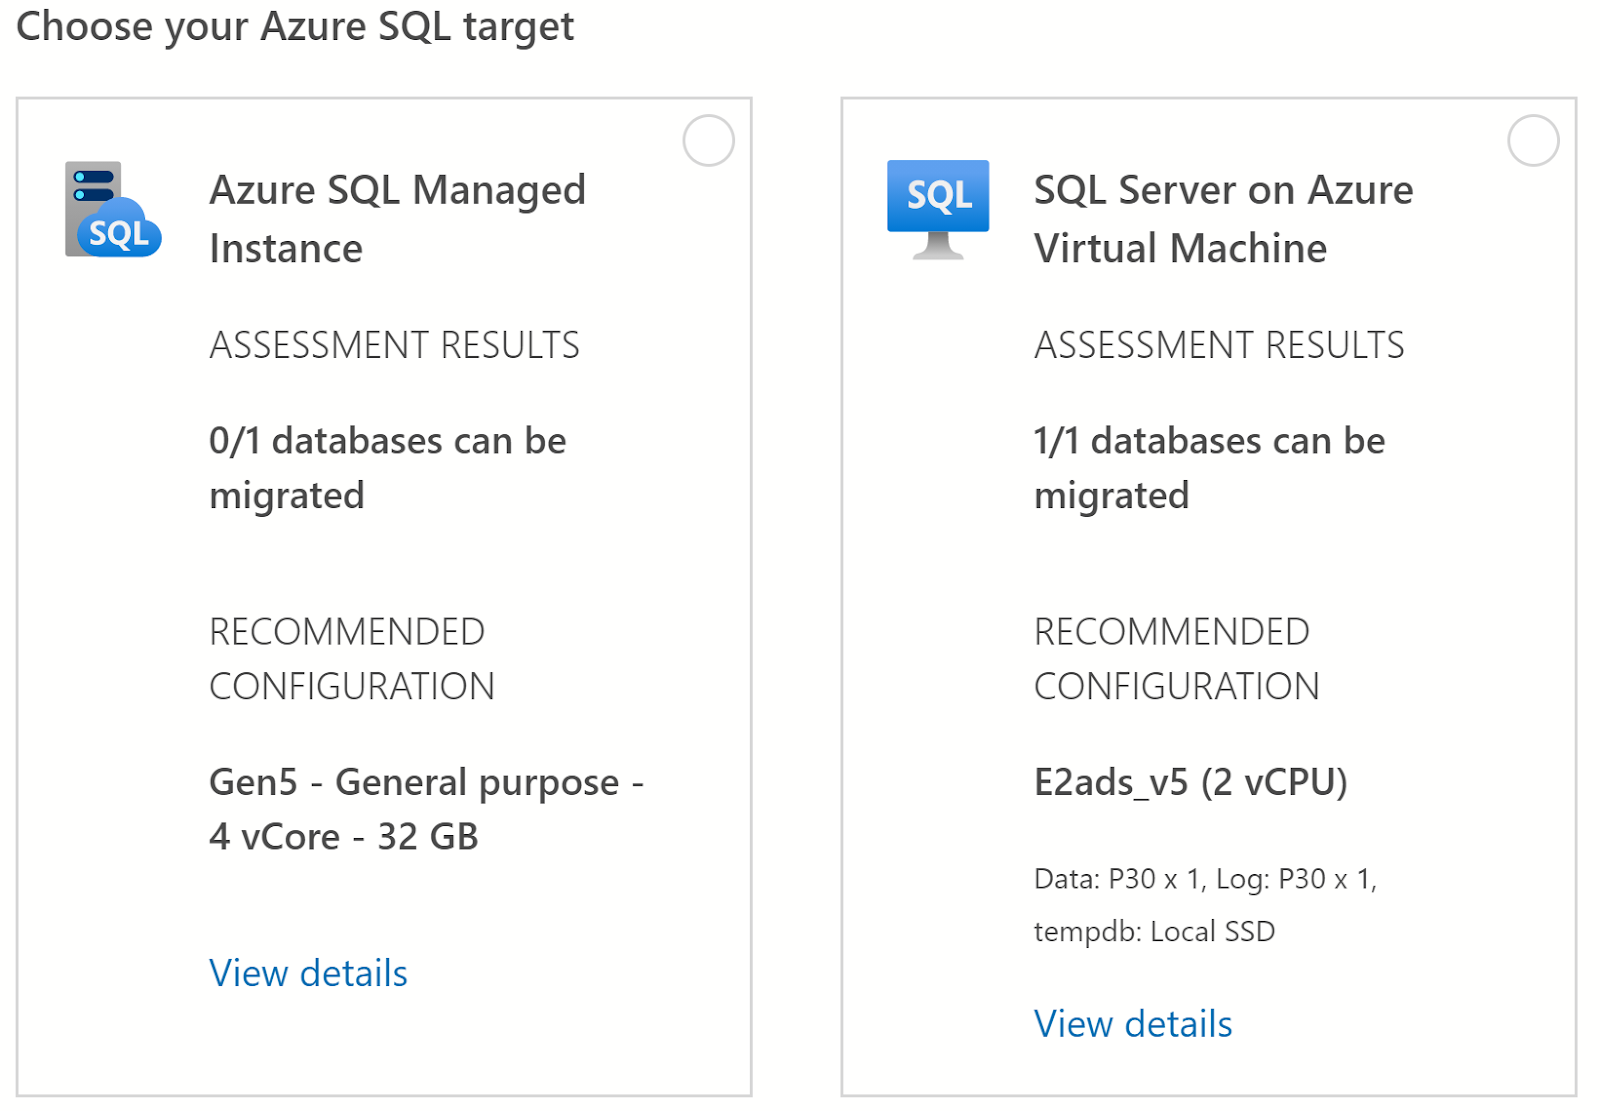
On the next screen we can see two migration options; Azure SQL Managed Instance and SQL Server on Azure Virtual Machine, at the bottom of the screen we'll click Get Azure Recommendation to start the performance data collection, as I haven't previously ran the collector I'll select Collect performance data now and specify a local folder where the data will be saved (once collected I can use the "I already have the performance data" option at a later time).


The data collector will run for about 10 minutes. It's worth mentioning that to be as accurate as possible the collector should be ran on "real life" workloads, if you run the collector during periods of low activity then the chances are the recommendations will be for a lower specification than what you might actually require in Azure. 


Once the data collection has completed the recommendations are automatically refreshed under each of the migration targets. In this case for Azure SQL Managed Instance it has recommended the Gen5 General Purpose 4 vCore option (32 GB) and for SQL Server on Azure Virtual Machine the E2ads_v5 2 vCPU option. 


But...

Under the Azure SQL Managed Instance option the assessment results show that 0/1 databases can be migrated. To see any issues I need to select the Managed Instance option and click Next (if you don't select a target you'll get a nice red banner telling you off).

I expected to go the the next screen but actually I couldn't and instead had to select a database and it's assessment button from this button at the bottom of the screen (in truth I found it a bit fiddly, but never mind):


The next screen shows that I have a potential migration issue on the WideWorldImporters database, I can select the database using the checkbox next to it to view the relevant information: 


Here's the problem:


In terms of performance data the recommendation is for the General Purpose service tier of Azure SQL Managed Instance however as the WideWorldImporters database makes use of in-memory tables these are not supported and is actually only supported on the Business Critical service tier.

But that's the whole point of a migration assessment tool, not only does the extension gauge database performance and recommend the correct SKU it also identifies potential migration issues such as unsupported functionality, and without a doubt the more you know beforehand the better!

Wednesday, February 2, 2022

Duplicate Indexes - Which index does the Query Optimiser use?

It's well documented that duplicate indexes are literally a waste of space so I'm not going to blog about that, here's a post from Kevin Hill that covers what you need to know:

Duplicate Indexes Explained - DallasDBAs.com

Lets take the following query that I will run against the AdventureWorks2019 sample database:

SELECT FirstName, LastName, MiddleName
FROM Person.Person p
WHERE FirstName = 'Allison' AND LastName = 'Stewart'
OPTION (RECOMPILE);

Here's the plan:

As there is an index that has the LastName and FirstName columns the optimiser has opted for an index seek operator using the IX_Person_LastName_FirstName_MiddleName index, and if I look into the Plan XML I can see that it's using a trivial plan: StatementOptmLevel="TRIVIAL".

This basically means there's one obvious way to return the query results so the optimiser has avoided the cost of going through full optimisation and has elected to use this plan straightaway.

So what happens if I create an identical copy of that particular index, in fact let's create five indexes that are exactly the same:

CREATE NONCLUSTERED INDEX [IX_Person_LastName_FirstName_MiddleName_1] ON [Person].[Person]
(
[LastName] ASC,
[FirstName] ASC,
[MiddleName] ASC
)WITH (PAD_INDEX = OFF, STATISTICS_NORECOMPUTE = OFF, SORT_IN_TEMPDB = OFF, DROP_EXISTING = OFF, ONLINE = OFF, ALLOW_ROW_LOCKS = ON, ALLOW_PAGE_LOCKS = ON, OPTIMIZE_FOR_SEQUENTIAL_KEY = OFF) ON [PRIMARY]
GO

CREATE NONCLUSTERED INDEX [IX_Person_LastName_FirstName_MiddleName_2] ON [Person].[Person]
(
[LastName] ASC,
[FirstName] ASC,
[MiddleName] ASC
)WITH (PAD_INDEX = OFF, STATISTICS_NORECOMPUTE = OFF, SORT_IN_TEMPDB = OFF, DROP_EXISTING = OFF, ONLINE = OFF, ALLOW_ROW_LOCKS = ON, ALLOW_PAGE_LOCKS = ON, OPTIMIZE_FOR_SEQUENTIAL_KEY = OFF) ON [PRIMARY]
GO

CREATE NONCLUSTERED INDEX [IX_Person_LastName_FirstName_MiddleName_3] ON [Person].[Person]
(
[LastName] ASC,
[FirstName] ASC,
[MiddleName] ASC
)WITH (PAD_INDEX = OFF, STATISTICS_NORECOMPUTE = OFF, SORT_IN_TEMPDB = OFF, DROP_EXISTING = OFF, ONLINE = OFF, ALLOW_ROW_LOCKS = ON, ALLOW_PAGE_LOCKS = ON, OPTIMIZE_FOR_SEQUENTIAL_KEY = OFF) ON [PRIMARY]
GO

CREATE NONCLUSTERED INDEX [IX_Person_LastName_FirstName_MiddleName_4] ON [Person].[Person]
(
[LastName] ASC,
[FirstName] ASC,
[MiddleName] ASC
)WITH (PAD_INDEX = OFF, STATISTICS_NORECOMPUTE = OFF, SORT_IN_TEMPDB = OFF, DROP_EXISTING = OFF, ONLINE = OFF, ALLOW_ROW_LOCKS = ON, ALLOW_PAGE_LOCKS = ON, OPTIMIZE_FOR_SEQUENTIAL_KEY = OFF) ON [PRIMARY]
GO

CREATE NONCLUSTERED INDEX [IX_Person_LastName_FirstName_MiddleName_5] ON [Person].[Person]
(
[LastName] ASC,
[FirstName] ASC,
[MiddleName] ASC
)WITH (PAD_INDEX = OFF, STATISTICS_NORECOMPUTE = OFF, SORT_IN_TEMPDB = OFF, DROP_EXISTING = OFF, ONLINE = OFF, ALLOW_ROW_LOCKS = ON, ALLOW_PAGE_LOCKS = ON, OPTIMIZE_FOR_SEQUENTIAL_KEY = OFF) ON [PRIMARY]
GO

As a side thought; wouldn't it be great if Clippy appeared and told me I already had an index with the same columns and that these weren't needed? It would be great, but SQL doesn't check for these things so the duplicate indexes get created straight with no fuss.

Now the first thing I wondered was if the optimiser would not use full optimisation because it has additional indexes to think about but no, looking at the Plan XML I see that a trivial plan has been used again: StatementOptmLevel="TRIVIAL". So what index has it used?


As we can see from the execution plan this time the optimiser has used the last index that I created; IX_Person_LastName_FirstName_MiddleName_5. Why? Well in all honesty I don't know, is it because the optimiser uses the very latest index by default. I'm not sure. But let's delete the index and see what happens:

DROP INDEX [IX_Person_LastName_FirstName_MiddleName_5] ON [Person].[Person]
GO

When I run the query it has again used the "latest" duplicate index:


I did wonder if it's in some way limited to trivial plans so I added a join to my query to give the optimiser something to think about and use full optimisation:

SELECT FirstName, LastName, MiddleName, b.BusinessEntityID 
FROM Person.Person p
INNER JOIN Person.BusinessEntity b ON p.BusinessEntityID = b.BusinessEntityID
WHERE FirstName = 'Allison' AND LastName = 'Stewart'
OPTION (RECOMPILE);

This time the Plan XML shows StatementOptmLevel="FULL" so the optimiser has had to do a bit of extra work, and if we look at the execution plan again we can see it's using the "latest" index again:


Now I'm going to have to do some more digging to see if the optimiser always uses the most recent or latest index, maybe it's default behaviour - if you know then please let me know!

And to clean things up I'll remove all those duplicate indexes before writing any more queries!

Monday, January 31, 2022

Things you shouldn't really do in SQL Server: Disabling Join Types Globally

A while ago I presented a session which covered transformation rules that are used by the query optimiser to produce our execution plans. I'm not feeling in the mood for relational algebra this morning so instead I'll introduce a command that can cause mayhem on an instance SQL Server: DBCC RULEOFF.

DBCC RULEOFF is an undocumented command, that alone makes me want to use it but in order to cover one's backside please don't do any of the following in any environment apart from a disposable sandbox that only you use for weird and wonderful experiments in SQL Server, because we are going to break it...

Let's take a simple query with a join:

SELECT e.BusinessEntityID, e.JobTitle, p.FirstName
FROM HumanResources.Employee e
INNER JOIN Person.Person p
ON e.BusinessEntityID = p.BusinessEntityID;

If I look at the estimated execution plan I can see that the optimiser has selected a nested loop join:


Now I could use the QUERYRULEOFF hint to disable that join for this particular query and for this particular join type I'd need two different hints to disable nested loop operators for the join:

OPTION (QUERYRULEOFF JNtoNL, QUERYRULEOFF JNtoIdxLookup);

This will force the optimiser to use a different join type and the estimated plan this time shows a hash match join but for this article we're not looking at QUERYRULEOFF, we're looking at DBCC RULEOFF which will still do the same thing only it's not for one query, it's for the entire instance.

MWAHAHAHAHAHAHA

That's right, running DBCC RULEOFF('JNtoNL') will essentially switch off the nested loop join for every single query running on my instance, well, sort of. After running the command I can check what rules are off on my instance by first running DBCC TRACEON(3604) to redirect DBCC output to my messages tab and then run DBCC SHOWOFFRULES:

Rules that are off globally:

JNtoNL

That's just one of the rules though, so just as when I used the query hint with without nested loop joins I'll also run DBCC RULEOFF('JNtoIdxLookup') to disable the other transformation rule that the optimiser can use for a nested loop join and verify again with DBCC SHOWOFFRULES. Now that they're both disabled the estimated plan looks a bit different and is using a hash match operator instead.

A different logical join type will not be affected. If I change the INNER JOIN to a LEFT JOIN and check the execution plan I will see a nested loop operator again.

SELECT e.BusinessEntityID, e.JobTitle, p.FirstName
FROM HumanResources.Employee e
LEFT JOIN Person.Person p
ON e.BusinessEntityID = p.BusinessEntityID;

This is how transformation rules work, essentially they are a substitution for a logical operation (INNER JOIN, LEFT JOIN etc) for a physical operation, that is the operator we see in the execution plan. So far we've only disabled the following rules JNtoNL and JNtoIdxLookup and they only affect the INNER JOIN logical operations. 

For left joins we'll need to switch off the corresponding transformation rules (LOJNtoNL and LeftSideJNtoIdxLookup) and when done we can see the same effect on the estimated execution plan as before where the optimiser has used a hash match join.

Now whilst I can make a case of disabling rules at a query level to check execution plans using different join types (or you could use join hints) I can't really make the same case for disabling them at an instance level. But this post is titled "Things you shouldn't really do..." so let's do something completely reckless.

If I run the following query I can see every transformation rule that contains 'JN' as in JOIN and I've also included the command to disable that rule:

SELECT [name], 'DBCC RULEOFF (''' + [name] + ''');' AS [DontDoIt!!!]
FROM sys.dm_exec_query_transformation_stats
WHERE [name] LIKE '%JN%';

For no other reason but for widespread chaos I can now disable every transformation rule that substitute joins by running each all of the commands returned by my query. Now things are so bad that if I try to run my query I get the following error:

Msg 8624, Level 16, State 1, Line 5
Internal Query Processor Error: The query processor could not produce a query plan. For more information, contact Customer Support Services.

I think that means it's broken, at least if I want to join any tables anyway!

So please, please, please don't do this. There's literally no reason to do so on any SQL system of any kind. I will put everything back by running the following so I can generate the commands to switch on all rules once again and verify with DBCC SHOWOFFRULES that nothing has remained disabled. 

SELECT [name], 'DBCC RULEON (''' + [name] + ''');' AS [DoIt!!!]
FROM sys.dm_exec_query_transformation_stats
WHERE [name] LIKE '%JN%';

Another reason why I stay well away from relational algebra.

SQL Server Management Studio: Database Reports - All Blocking Transactions

I've used SQL Server Management Studio for many years and whilst there's other options out there like Azure Data Studio, SQLCMD  or PowerShell it's mainly my go to option for doing stuff in SQL Server.

For most DBA I write T-SQL code; for example I haven't used Activity Monitor for a long time and instead prefer the use of Dynamic Management Objects to query out the bits of information that I need.  

But Management Studio does have some useful functionality in there. If I right click on a database, select Reports and Standard Reports I get a list of all kinds of different reports where I see what's 

I'll be honest, I've occasionally used the Disk Usage reports and apart from that I had no idea what else was in here so I've decided to look at the All Blocking Transactions report in action being that it's a fairly common monitoring task and in order to do that I'll run the following update statement in a transaction without committing it or rolling it back:

BEGIN TRAN

UPDATE Person.Person
SET FirstName = 'Dave'
WHERE FirstName = 'David' and LastName = 'Bartness';

When I run this code I will get a message saying that 1 row has been affected but as my transaction is still open my update has not been committed which means if I try to run a select query on that same table in another query window I will run into a classic case of blocking:

SELECT * FROM [AdventureWorks2019].[Person].[Person]

My select query is now in a bit of limbo, and in Management Studio I can see that it's stuck executing my query, now let's run the report:

In this report I am seeing the blocking transaction, often referred to as the header blocker. The Session ID is 62 which is my original update query and the report is showing that it's directly blocking one other transaction. 

In order to see what queries are being blocked I can expand the first column of the report, Transaction ID (in this case 151616) which returns the details of my blocked select statement:


Now as I mentioned earlier on in the post I don't often use Management Studio for much else other than writing queries. I've captured the query used by this particular report and it's, well here it is:

exec sp_executesql @stmt=N'begin try 

declare @tab_tran_locks as table( 
        database_id int   
,       l_resource_type nvarchar(60) collate database_default    
,       l_resource_subtype nvarchar(60) collate database_default
,       l_resource_associated_entity_id bigint   
,       l_blocking_request_spid int   
,       l_blocked_request_spid int   
,       l_blocking_request_mode nvarchar(60) collate database_default   
,       l_blocked_request_mode nvarchar(60) collate database_default   
,       l_blocking_tran_id bigint
,   l_blocked_tran_id bigint   
); 
declare @tab_blocked_tran as table (
        tran_id bigint 
,       no_blocked bigint
);  
declare @temp_tab table( 
        blocking_status int 
,       no_blocked int 
,       database_id int 
,       l_resource_type nvarchar(60) collate database_default  
,       l_resource_subtype nvarchar(60) collate database_default  
,   l_resource_associated_entity_id bigint 
,       l_blocking_request_spid int 
,       l_blocked_request_spid int
,       l_blocking_request_mode nvarchar(60) collate database_default 
,       l_blocked_request_mode nvarchar(60) collate database_default 
,       l_blocking_tran_id bigint
,   l_blocked_tran_id bigint
,   local1 int
,       local2 int
,       b_tran_id bigint
,       w_tran_id bigint
,       b_name nvarchar(128) collate database_default 
,       w_name nvarchar(128) collate database_default 
,       b_tran_begin_time datetime
,       w_tran_begin_time datetime
,       b_state nvarchar(60) collate database_default 
,       w_state nvarchar(60) collate database_default 
,       b_trans_type nvarchar(60) collate database_default 
,       w_trans_type nvarchar(60) collate database_default 
,       b_text nvarchar(max) collate database_default 
,       w_text nvarchar(max) collate database_default 
,       db_span_count1 int
,       db_span_count2 int 
);
insert into @tab_tran_locks 
select                          
        a.resource_database_id
,       a.resource_type
,       a.resource_subtype
,       a.resource_associated_entity_id
,       a.request_session_id as blocking 
,       b.request_session_id as blocked
,       a.request_mode
,       b.request_mode
,       a.request_owner_id
,       b.request_owner_id   
from sys.dm_tran_locks a 
join sys.dm_tran_locks b on   (a.resource_type = b.resource_type and a.resource_subtype = b.resource_subtype and a.resource_associated_entity_id = b.resource_associated_entity_id and a.resource_description = b.resource_description)  
where (a.request_status = ''GRANT'' and (b.request_status = ''WAIT'' or b.request_status = ''CONVERT'')) and a.request_owner_type = ''TRANSACTION'' and b.request_owner_type = ''TRANSACTION'';

insert into @tab_blocked_tran  
select ttl.l_blocking_tran_id
,       count(distinct ttl.l_blocked_tran_id) 
from @tab_tran_locks ttl   
group by ttl.l_blocking_tran_id 
order by count( distinct ttl.l_blocked_tran_id) desc 

insert into @temp_tab  
select  0 as blocking_status
,       tbt.no_blocked
,       ttl.*
,       st1.is_local as local1
,       st2.is_local as local2
,       st1.transaction_id as b_tran_id
,       ttl.l_blocked_tran_id as w_tran_id
,       at1.name as b_name
,       at2.name as w_name
,       at1.transaction_begin_time as b_tran_begin_time
,       at2.transaction_begin_time as w_tran_begin_time
,       case when at1.transaction_type <> 4 
                 then case at1.transaction_state 
                                when 0 then ''Invalid''
                                when 1 then ''Initialized''
                                when 2 then ''Active''
                                when 3 then ''Ended''
                                when 4 then ''Commit Started''
                                when 5 then ''Prepared''
                                when 6 then ''Committed''
                                when 7 then ''Rolling Back''
                                when 8 then ''Rolled Back''
                        end 
                 else case at1.dtc_state 
                                when 1 then ''Active''
                                when 2 then ''Prepared''
                                when 3 then ''Committed''
                                when 4 then ''Aborted''
                                when 5 then ''Recovered''
                        end 
        end b_state
,       case when at2.transaction_type <> 4 
                then case at2.transaction_state 
                                when 0 then ''Invalid''
                                when 1 then ''Initialized''
                                when 2 then ''Active''
                                when 3 then ''Ended''
                                when 4 then ''Commit Started''
                                when 5 then ''Prepared''
                                when 6 then ''Committed''
                                when 7 then ''Rolling Back''
                                when 8 then ''Rolled Back''
                        end 
                 else case at1.dtc_state 
                                when 1 then ''Active''
                                when 2 then ''Prepared''
                                when 3 then ''Committed''
                                when 4 then ''Aborted''
                                when 5 then ''Recovered''
                        end 
        end w_state
,       at1.transaction_type as b_trans_type
,               at2.transaction_type  as w_trans_type
,       case when r1.sql_handle IS NULL then ''--'' else ( select top 1 substring(text,(r1.statement_start_offset+2)/2, (case when r1.statement_end_offset = -1   then (len(convert(nvarchar(MAX),text))*2) else r1.statement_end_offset  end - r1.statement_start_offset) /2  ) from sys.dm_exec_sql_text(r1.sql_handle)) end as b_text
,       case when r2.sql_handle IS NULL then ''--'' else ( select top 1 substring(text,(r2.statement_start_offset+2)/2, (case when r2.statement_end_offset =-1 then len(convert(nvarchar(MAX),text))*2  when r2.statement_end_offset =0  then len(convert(nvarchar(MAX),text))*2  else r2.statement_end_offset  end - r2.statement_start_offset) /2  ) from sys.dm_exec_sql_text(r2.sql_handle)) end as w_text 
,       ( Select count(distinct database_id) from sys.dm_tran_database_transactions where transaction_id = st1.transaction_id ) as db_span_count1
,       ( Select count(distinct database_id) from sys.dm_tran_database_transactions where transaction_id = st2.transaction_id ) as db_span_count2  
from @tab_tran_locks ttl 
inner join sys.dm_tran_active_transactions at1 on(at1.transaction_id = ttl.l_blocking_tran_id) 
inner join @tab_blocked_tran tbt on(tbt.tran_id = at1.transaction_id)  
inner join sys.dm_tran_session_transactions st1 on(at1.transaction_id = st1.transaction_id) 
left outer join sys.dm_exec_requests r1 on(at1.transaction_id = r1.transaction_id ) 
inner join sys.dm_tran_active_transactions at2 on(at2.transaction_id = ttl.l_blocked_tran_id) 
left outer join sys.dm_tran_session_transactions st2  on(at2.transaction_id = st2.transaction_id)  
left outer join  sys.dm_exec_requests r2 on(at2.transaction_id = r2.transaction_id ) 
where st1.is_user_transaction = 1
order by tbt.no_blocked desc;

declare @db_blocking_tab table (
        database_id int
,       blocking_status int
,       no_blocked int
,       total_blocked int
,       l_resource_type nvarchar(60) collate database_default 
,       l_resource_subtype nvarchar(60) collate database_default 
,       l_resource_associated_entity_id bigint
,       l_blocking_request_spid int
,       l_blocked_request_spid int
,       l_blocking_request_mode nvarchar(60) collate database_default 
,       l_blocked_request_mode nvarchar(60) collate database_default 
,       local1 int
,       local2 int
,       b_tran_id bigint
,       w_tran_id bigint
,       b_name nvarchar(128) collate database_default 
,       w_name nvarchar(128) collate database_default 
,       b_tran_begin_time datetime
,       w_tran_begin_time datetime
,       b_state nvarchar(60) collate database_default 
,       w_state nvarchar(60) collate database_default 
,       b_trans_type nvarchar(60) collate database_default 
,       w_trans_type nvarchar(60) collate database_default 
,       b_text nvarchar(max) collate database_default 
,       w_text nvarchar(max) collate database_default 
,       db_span_count1 int
,       db_span_count2 int
,       lvl int
); 

declare @b_tran_id_tab table (  tran_id bigint);

WITH Blocking(
        database_id
,       blocking_status
,       no_blocked
,       total_blocked
,       l_resource_type
,       l_resource_subtype
,       l_resource_associated_entity_id
,       l_blocking_request_spid
,       l_blocked_request_spid
,       l_blocking_request_mode
,       l_blocked_request_mode
,       local1
,       local2
,       b_tran_id
,       w_tran_id
,       b_name
,       w_name
,       b_tran_begin_time
,       w_tran_begin_time
,       b_state
,       w_state
,       b_trans_type
,       w_trans_type
,       b_text
,       w_text
,       db_span_count1
,       db_span_count2
,       lvl)  
AS ( SELECT 
        database_id
,       blocking_status
,       no_blocked
,   no_blocked
,       l_resource_type
,       l_resource_subtype
,       l_resource_associated_entity_id
,       l_blocking_request_spid
,       l_blocked_request_spid
,       l_blocking_request_mode
,       l_blocked_request_mode
,       local1
,       local2
,       b_tran_id
,       w_tran_id
,       b_name
,       w_name
,       b_tran_begin_time
,       w_tran_begin_time
,       b_state
,       w_state
,       b_trans_type
,       w_trans_type
,       b_text
,       w_text
,       db_span_count1
,       db_span_count2
,       0       
from @temp_tab          
UNION ALL       
SELECT E.database_id
,       E.blocking_status
,       M.no_blocked
,       convert(int,E.no_blocked + total_blocked)
,       E.l_resource_type
,       E.l_resource_subtype
,       E.l_resource_associated_entity_id
,       M.l_blocking_request_spid
,       E.l_blocked_request_spid
,       M.l_blocking_request_mode
,       E.l_blocked_request_mode
,       M.local1
,       E.local2
,       M.b_tran_id
,       E.w_tran_id
,       M.b_name
,       E.w_name
,       M.b_tran_begin_time
,       E.w_tran_begin_time
,       M.b_state
,       E.w_state
,       M.b_trans_type
,       E.w_trans_type
,       M.b_text
,       E.w_text
,       M.db_span_count1
,       E.db_span_count2
,       M.lvl+1         
from @temp_tab AS E                     
JOIN Blocking AS M ON E.b_tran_id = M.w_tran_id )  

insert into @db_blocking_tab 
select * from Blocking  

insert into @b_tran_id_tab 
select top 20 b_tran_id from @db_blocking_tab 
where database_id = db_id() group by b_tran_id order by max(total_blocked) desc ; 

select  (dense_rank() over (order by dbt.no_blocked desc,dbt.b_tran_id))%2 as l1 
,       (dense_rank() over (order by dbt.no_blocked desc,dbt.b_tran_id,dbt.w_tran_id))%2 as l2
,       dbt.* 
from @b_tran_id_tab btid 
left outer join @db_blocking_tab dbt on (btid.tran_id = dbt.b_tran_id)  
order by dbt.no_blocked desc, dbt.b_tran_id,dbt.w_tran_id  
end try 
begin catch 
select -100 as l1
,       ERROR_NUMBER() as l2
,       ERROR_SEVERITY() as blocking_status
,       ERROR_STATE() as no_blocked
,       ERROR_MESSAGE() as total_blocked
,       1 as l_resource_type,1 as l_resource_subtype,1 as l_resource_associated_entity_id,1 as l_blocking_request_spid,1 as l_blocked_request_spid,1 as l_blocking_request_mode,1 as l_blocked_request_mode,1 as local1,1 as local2,1 as b_tran_id,1 as w_tran_id,1 as b_name,1 as w_name,1 as b_tran_begin_time,1 as w_tran_begin_time,1 as b_state,1 as w_state,1 as b_trans_type,1 as w_trans_type,1 as b_text,1 as w_text,1 as db_span_count1,1 as db_span_count2,1 as lvl 
end catch',@params=N''

That's a pretty big query and whilst it does return some useful query level information I can't see other information such as the login details or the host name of the blocked/blocking queries that I might need to determine who to blame, sorry I mean take the appropriate course of action for resolving the blocking problems. 

So is there a better way? 

Well in my opinion, absolutely yes! 

I could use a third party script such as sp_whoisactive or this one from Pinal Dave both of which I can honestly say I use all of the time when investigating blocking, but I also encourage people to spend time looking into SQL's Dynamic Management Objects and the DMV's such as sys.dm_exec_requests and sys.dm_tran_locks, both of which are used in the query from the All Blocking Transactions report above. It's a great way to start peeking into the internals of SQL Server and working with their information to create custom scripts for monitoring and diagnosing problems.

Friday, January 28, 2022

SQL 2019: Physical reads are counted two times for read-aheads in sys.dm_exec_query_stats


Microsoft recently released Cumulative Update 15 for SQL Server 2019. It contains a bunch of fixes and some improvements, I get a bit geeky with updates like this and love to have a look through the different fixes to see 

"Physical reads for read-ahead reads are counted incorrectly (two times) when you run queries. Therefore, the information in sys.query_store_runtime_stats and sys.dm_exec_query_stats shows incorrect values."

So if you're using these management views to look at performance metrics for your queries you're going to get incorrect results and you might be thinking the queries are doing way more work than what they're actually doing.

In order to test this in a before and after update type scenario I'm going to first force SQL Server to clean out it's buffer pool using DBCC DROPCLEANBUFFERS and the procedure cache with DBCC FREEPROCCACHE (btw, don't do this on anything else other than a sandbox environment). This will ensure the next time I run a query it will have no pages in memory and will have to retrieve the pages from disk, and I'm clearing the procedure cache as I'm going to be querying the sys.dm_exec_query_stats DMV.

Test query: 

SELECT * FROM Person.Person  

I've set SET STATISTICS IO ON so I can see after my query has ran the logical, and in this case more importantly the physical reads of my query and it shows 3 physical reads and 3866 read-ahead reads (which are still from disk):

Table 'Person'. Scan count 1, logical reads 3821, physical reads 3, page server reads 0, read-ahead reads 3866

SELECT [text] AS QueryText, last_physical_reads FROM sys.dm_exec_query_stats
CROSS APPLY sys.dm_exec_sql_text(sql_handle)
WHERE [text] = 'SELECT * FROM Person.Person'

And I get the following results showing the last physical reads of my query was 7779, which is wrong:


I've now updated one of my test instances to CU15 and will run the same queries as before, and this time we have a much more accurate value returned from the DMV:


Now I should add there's still a difference between the statistics output and the sys.dm_exec_query_stats DMV for physical reads and to be totally honest I don't know exactly why but I've the question using #sqlhelp on Twitter and will update when I find out!

Tuesday, February 18, 2020

What I've been reading.

SQL Server 2019 Revealed from Bob Ward is my most current read, here's the Apress link which allows you to view a short preview of each chapter as well as directly downloading all of the source code for the book.


Anyone who uses SQL Server should be reading this. SQL Server 2019 is a very different release and there's a lot of new technology to understand but what I found great about this book is that it also explains the "why" behind the evolution of SQL Server into being a more complete Data Platform. 

The book introduces Big Data Clusters which includes a big technical stack including Apache Spark, Hadoop, Containers, Linux and the current top trend, Kubernetes. Naturally the book also includes all of the feature enhancements made inside the SQL 2019 engine and throughout is packed with example and it's nice to see Azure Data Studio feature in those too.

As said, if you're working with SQL Server you need this book, it's as simple as that!

If you haven't read it already then I can also recommend Pro SQL Server on Linux by Bob Ward (again), here's the Apress link (which again features previews). This book is a bit older and focuses on the 2017 release of SQL Server which was the first release to support Linux. It's a much heavier read (as in literally) and it does cover a lot of SQL Server functionality that seasoned professionals may be already aware of. 

That said the book is concise, again full of examples and introduces a lot of Linux code too that depending on background you might not be familair with. Linux is way more than just an option for SQL Server, it's a fundamental piece of the Data Platform vision so I would personally view this book as a necessity. In addition to this book I also purchased a copy of the Linux Bible which has been recommended by a good friend of mine, the copy I have dates back to 2015 and I've just seen that a newer edition is scheduled for release in June this year.

These two books perfectly demonstrate how the scope of SQL Server is embracing different technologies, none more so than Containers and Kubernetes, both of which (in my opinion) Microsoft are betting big on. With that in mind I'd recommend a couple of books from Nigel Poulton, Docker Deep Dive and The Kubernetes Book both of which I referred to numerous times since originally reading them. The Kubernetes book is more of an introductory read and covers many examples to get you going. As the name suggests, Docker Deep Dive is much more of a technical read but a technology as important as this does warrant a thorough understanding.

My final read is based purely on a personal learning choice and it's the official study guide for the AWS Certified Solutions Architect exam. Last year I passed the Azure Fundamentals exam and I always intended to take the AWS equivalent next (Cloud Practitioner) but this book covers that and the architect material as well and so far it's been really useful. 

So that's what I've been reading, I recommend all of the above, especially the SQL Server reads if you work on that platform. Would love to hear about any other recommendations!

Wednesday, September 18, 2019

Speaking at my first conference.


Recently I had the opportunity to speak at DATA:Scotland. It was my first time speaking at a conference where I presented my session on Guillotines, Sat-Nav and the Query Optimiser. During my time there I met quite a few people who were interested in speaking too but hadn't quite yet made the jump, so I thought I'd try and use a blog post to give people a helpful nudge.

Firstly, although this was my first conference I did get the opportunity to speak at a couple of local(ish) user groups beforehand. This was ideal because I could try out the session in front of a very friendly crowd and get a lot of instant feedback too. I could also get a feel for some of the bits that worked and some of the bits that didn't. 

I'd also read a lot about public speaking but in truth when it comes to actual delivery style I guess that's just develops (or is constantly developing) quite naturally. For me I throw in quite lot of humour into my session which helps me break the ice with the audience and build a rapport with them, but that is something that fits my personality and works for me. I guess if I try to be or present as someone else then it's probably not going to work.

I also try to speak about topics that I am really interested in, it sounds obvious but it's also true. I'm quite happy to talk about the query optimiser because I really enjoy the inner workings of SQL Server, particularly around optimisation. Ask me to talk about merge replication and a session will be totally different, or more than likely non-existent!  

Practice is key. Another rather obvious bit of wisdom but another that is also completely true. I would go over parts in the car, in the shower, in my sleep and to my rehearsal audience of the dogs. For me it's about constantly tuning the delivery; what works, what doesn't sound right, would this slide be better over there, does this even make sense etc etc?! 

I'd also add that the practice doesn't end after delivery, I'm still very much making tweaks!

Having the support of DATA:Scotland was crucial. They provided me with a speaker mentor, Alex Yates, who provided some absolutely priceless insights into speaking and gave me some awesome advice on my session. After our first talk I genuinely was full of ideas because I was able to look at the session from an attendees perspective, something I hadn't really done. Now I had questions such as, "why is this useful to me?" or "how does this make me do my job better?" in mind when putting it all together.

Having the newcomer session option was a big nudge for me. I'm not even sure I would have submitted a session without it and genuinely I think it's brilliant. Not only did I have a superb mentor but there was also a couple of web sessions on presenting. Also, being introduced as a new speaker at the conference helped too, it didn't feel like I was plunging into the deep end as much!  

There's loads more and I'll definitely write more about the experience but what I will say/write is that just before I went into the room I told myself that never again would I be experiencing speaking at a conference for the first time again. This was it and I needed to immerse myself in the experience, nerves and all, as much as I could. I like to think I did just that and as such it was one of the most rewarding experiences of my life.

It's also rather addictive. 

If you are wondering about it then reach out to the community, local user group or even me, I'm more than happy to share my experience of speaking and give any advice that I can (though wisdom may be rather limited).

Friday, July 19, 2019

DATA:Scotland 2019. Unleashing the Guillotine!!!

Friday 13th of September will be my first ever appearance at a conference as a speaker at DATA:Scotland. Needless to say I cannot wait and I'd like to thank the organisers, selectors or whoever it was that drew out the short straw that is me.

I'll be presenting my intriguingly titled 'Guillotines, Sat-Nav and the Query Optimiser' session which I presented at the Manchester and Leeds User Groups earlier this year. The user groups have proved to be a really useful experience as some of the questions that were raised from the audience I've taken onboard and added in, basically I've been stealing their ideas.

My session starts at 12 which unfortunately for me is when my daily caffeine intake usually starts to wear off right at the same time I start to get hungry so I might take up a flask of espresso and a couple of wagon wheels to keep me going. I'll be in conference room 7 which also happens to my lucky number, so that's good news.

Something very new to me is that there will be presenters presenting their sessions at the same time as me and as such I need view these SQL superstars as, well, the competition I guess. I'm not entirely sure what tactics to deploy to get people to come and see me instead; media smear campaigns, good old fashioned kidnapping or perhaps just go really heavy on the propaganda...a bit like this blog post.

The truth is I'm very much overwhelmed at seeing my name up there on that schedule surrounded by people who in all honesty I hold in the absolute highest regard, and I also promise not to kidnap anyone (is their an emoji for fingers crossed behind your back?).

So what can people expect? Well at the moment we're in the midst of an amazing shift in the technical landscape. We've got all this funky cool new stuff like AI, the cloud, containers, Kubernetes etc etc etc and obviously I thought not to cover any of that. No, apparently vintage is all the rage these days so I'm jumping right on that bandwagon!

It may be old school but the query optimiser to me is like the magic box of SQL Server. We all throw queries at it and it goes off and does what it does, that's the beauty of it but at the same time we don't often get chance to open the box and have a good root around - and that's where this session comes in. So I'll be covering how the optimiser works, some of the magic tricks that it performs, how we can use SQL to keep a very close eye on what the optimiser is doing and of course how to break it!

It's worth adding that I will also be trying my best to seamlessly link the query optimiser to guillotines and satellite navigation - that'll teach me to come up with a great title before the actual presentation. I say that but I am currently working on a new session called "fixing your availability groups with sticky back plastic", take note Blue Peter (is that even still on?).

As well as the actual learning stuff (which I promise, there's plenty) there's a few ice breakers in there which I'll not give away right now and there's a good sense of humour throughout, which is mostly directed at the expense of myself.

So if you are attending DATA:Scotland all that's left is for me to beg, plead, perhaps even bribe you to come along to my session; if you choose otherwise I'll not hold it against you...and if you're not attending but stumbled on to this post by accident then thanks for reading if you got this far!

Breaking up with SQL Server

I was inspired to write this after reading a post from Dave Mason regarding breaking up with Big Tech companies. Yet again I haven't wr...