Showing posts with label T-SQL. Show all posts

Tuesday, March 8, 2022

Watching Optimisation Phases with Trace Flag 8675

When a query is executed a few things happen; the query is parsed, a logical tree of the query is created, the query is simplified and then the optimiser determines if a trivial plan can be used. If a trivial plan can't be used, essentially if the optimiser has to figure out the optimal execution plan (such as making decisions on joins) then the query is passed to the full optimisation stage.

The full optimisation stage is where the optimiser uses a bag of tricks to optimise our query (surprise, surpise), well technically it has three bags of tricks that are named optimisation phases that each contain a collection of transformation rules (which I cover in this post that you should never do). The optimiser is not limited to using just one of the phases and each has a set criteria which determines if the optimiser can use that particular phase.

In order to see what how the optimiser is using these phases we need to enable Trace Flag 8675 as well as Trace Flag 3604 which will redirect the output to the query messages tab in Management Studio:

DBCC TRACEON(8675, -1); 

DBCC TRACEON(3604, -1);

Let's start with a very straightforward query on the AdventureWorks2019 sample database and for each of the queries we can actually run them or show the estimated execution plan which will still use the query optimisation process:

SELECT * FROM Person.Person OPTION (RECOMPILE);

Which when I check the output in the messages tab I can the following:

End of simplification, time: 0 net: 0 total: 0 net: 0

End of post optimization rewrite, time: 0 net: 0 total: 0 net: 0.001

End of query plan compilation, time: 0 net: 0 total: 0 net: 0.001

For this query we don't see any information relating to optimisation phases, that's expected because for this query the optimiser has used a trivial plan, which we can check in the plan properties:


If we re-run the query excluding the OPTION (RECOMPLILE) and again check the messages tab we don't see anything in the messages tab this time. This is because the query has been retrieved from the plan cache or procedure cache as it is also known. 

Now I'll add a join to the query to give the optimiser something to think about and use the RECOMPILE option to ensure the query is not retrieved from cache:

SELECT * FROM Person.Person per
INNER JOIN Sales.Customer cus ON cus.PersonID = per.BusinessEntityID
OPTION (RECOMPILE);

This time in the messages output we can see a line for search(1) which is also knowns as the Quick Plan optimisation phase:

End of simplification, time: 0.002 net: 0.002 total: 0 net: 0.002

end exploration, tasks: 57 no total cost time: 0.001 net: 0.001 total: 0 net: 0.004

end search(1),  cost: 3.99696 tasks: 211 time: 0.002 net: 0.002 total: 0 net: 0.006

End of post optimization rewrite, time: 0 net: 0 total: 0 net: 0.006

End of query plan compilation, time: 0 net: 0 total: 0 net: 0.007

Here we can see that the optimiser has produced an execution plan with a cost of 3.9969 and I can check that against either the estimated or actual plan in management studio by hovering over the left most operator (in this case the Select) and checking the Subtree cost, the below image is from the estimated plan showing the estimated cost to be 3.99696


In order to demonstrate the optimiser using multiple phases I'll add a join to another table. There is another optimisation phase, search(0) named Transaction Processing where the transformation rules are used for OLTP type queries. The optimiser didn't start with search(0) for our previous query because there has to be at least three tables used in the query in order for the optimiser to use this particular phase.

SELECT * FROM Person.Person per
INNER JOIN Sales.Customer cus ON cus.PersonID = per.BusinessEntityID
INNER JOIN Sales.SalesOrderHeader soh ON soh.CustomerID = cus.CustomerID 
OPTION (RECOMPILE);

Again using the RECOMPILE this time we're using three tables in the query (Person.Person, Sales.Customer and Sales.SalesOrderHeader) and if we look at the message output after the query has executed we can see the use of two optimisation phases; search(0) and search(1) and corresponding time that the optimiser has spent in each phase:

End of simplification, time: 0.004 net: 0.004 total: 0 net: 0.004

end exploration, tasks: 71 no total cost time: 0.005 net: 0.005 total: 0 net: 0.01

end search(0),  cost: 14.5642 tasks: 386 time: 0.008 net: 0.008 total: 0 net: 0.018

end exploration, tasks: 572 Cost = 14.5642 time: 0.002 net: 0.002 total: 0 net: 0.021

end search(1),  cost: 6.57863 tasks: 1027 time: 0.01 net: 0.01 total: 0 net: 0.031

End of post optimization rewrite, time: 0 net: 0 total: 0 net: 0.032

End of query plan compilation, time: 0.002 net: 0.002 total: 0 net: 0.035

The interesting thing here is the cost difference between the optimisation phases, the search(0) phase returned a query plan with a cost of 14.5642 however by using the search(1) phase the query has used a plan with an associated cost of 6.57863 which is a clear improvement.

There is another phase, stage(2) which is the full optimisation phase that contains every single transformation rule available. I'll cover that in a forthcoming post and in the meantime I'll write a horrible enough query to use that phase and we'll look into optimiser timeouts as well.

Trace Flag 8675 is one of those little known trace flags (IMO) that gives us some in-depth information on how the query optimiser is working. 

To finish off, to disable the trace flags I should now run the following: 

DBCC TRACEOFF(8675, -1); 

DBCC TRACEOFF(3604, -1);

Monday, March 7, 2022

Database offline worked fine, database online didn't!

I was browsing the SQL Server subreddit earlier where someone had posted a problem where they'd been able to take a database offline but couldn't bring the database back online via a script or the UI in SSMS (full thread here).

There's a bit of a back story; all the DBA's have left the business (facepalm) so a non-DBA has been left with the admin type tasks. Secondly the reason the database was being taken offline was to take physical backups of the databases mdf and ldf files (double facepalm).

Anyway, on the issue itself. My first thought was permissions, because it always is...or at least we can't blame DNS this time. But I had a slight doubt, surely if you had permissions to take a database offline you can bring it back?

Well, nope.

Being a member of the db_owner role will give you the required access to take a database offline. I'm going to test it on my machine as we go along:

CREATE LOGIN [supertester] WITH PASSWORD=N'MEG4PASSword.77', DEFAULT_DATABASE=[master], DEFAULT_LANGUAGE=[us_english], CHECK_EXPIRATION=OFF, CHECK_POLICY=OFF

GO

Then I'll change database context to my imaginatively named Test database and add the supertester user and add it to the db_owner role:

USE Test

GO

CREATE USER [supertester] FOR LOGIN [supertester];

EXEC sp_addrolemember N'db_owner', N'supertester';

I've logged into SSMS as the supertester login, the first thing I want to try is taking the database offline but I'm going to select to Drop All Active Connections:


I get the following error on VIEW SERVER STATE permissions being denied:


However, if I run the following T-SQL command the database successfully goes offline:

ALTER DATABASE Test SET OFFLINE WITH ROLLBACK IMMEDIATE; 

So, supertester has been able to offline the Test database, now to bring it back:

ALTER DATABASE Test SET ONLINE;

Unfortunately I'm greeted by the following red text:

Msg 5011, Level 14, State 9, Line 1

User does not have permission to alter database 'Test', the database does not exist, or the database is not in a state that allows access checks.

Msg 5069, Level 16, State 1, Line 1

ALTER DATABASE statement failed.

Oh dear...or words to that effect, db_owner role members can take databases offline but not bring the databases back online again. In this case it's going need elevated permissions, either ALTER ANY DATABASE being granted or maybe sysadmin role membership, especially if they're going to be taking on more admin type activities in the future.

The final note has to be about this whole scenario. I really feel for accidental/reluctant DBA's who are tasked (or rather thrown in to the deep end) with all kinds of activities without any support whatsoever. This is a perfect example where someone has been following instructions (admittedly they make no sense) without any real understanding and through no fault of their own has ended up in what could be a critical situation.

Yes, let's of people jumped into the thread to help which is awesome, and you know it's such a great thing about the SQL community that people are always willing to help but this is something that could have been avoided.

Finally I'll drop the supertester user and login because they're always up to no good.

Wednesday, February 2, 2022

Duplicate Indexes - Which index does the Query Optimiser use?

It's well documented that duplicate indexes are literally a waste of space so I'm not going to blog about that, here's a post from Kevin Hill that covers what you need to know:

Duplicate Indexes Explained - DallasDBAs.com

Lets take the following query that I will run against the AdventureWorks2019 sample database:

SELECT FirstName, LastName, MiddleName
FROM Person.Person p
WHERE FirstName = 'Allison' AND LastName = 'Stewart'
OPTION (RECOMPILE);

Here's the plan:

As there is an index that has the LastName and FirstName columns the optimiser has opted for an index seek operator using the IX_Person_LastName_FirstName_MiddleName index, and if I look into the Plan XML I can see that it's using a trivial plan: StatementOptmLevel="TRIVIAL".

This basically means there's one obvious way to return the query results so the optimiser has avoided the cost of going through full optimisation and has elected to use this plan straightaway.

So what happens if I create an identical copy of that particular index, in fact let's create five indexes that are exactly the same:

CREATE NONCLUSTERED INDEX [IX_Person_LastName_FirstName_MiddleName_1] ON [Person].[Person]
(
[LastName] ASC,
[FirstName] ASC,
[MiddleName] ASC
)WITH (PAD_INDEX = OFF, STATISTICS_NORECOMPUTE = OFF, SORT_IN_TEMPDB = OFF, DROP_EXISTING = OFF, ONLINE = OFF, ALLOW_ROW_LOCKS = ON, ALLOW_PAGE_LOCKS = ON, OPTIMIZE_FOR_SEQUENTIAL_KEY = OFF) ON [PRIMARY]
GO

CREATE NONCLUSTERED INDEX [IX_Person_LastName_FirstName_MiddleName_2] ON [Person].[Person]
(
[LastName] ASC,
[FirstName] ASC,
[MiddleName] ASC
)WITH (PAD_INDEX = OFF, STATISTICS_NORECOMPUTE = OFF, SORT_IN_TEMPDB = OFF, DROP_EXISTING = OFF, ONLINE = OFF, ALLOW_ROW_LOCKS = ON, ALLOW_PAGE_LOCKS = ON, OPTIMIZE_FOR_SEQUENTIAL_KEY = OFF) ON [PRIMARY]
GO

CREATE NONCLUSTERED INDEX [IX_Person_LastName_FirstName_MiddleName_3] ON [Person].[Person]
(
[LastName] ASC,
[FirstName] ASC,
[MiddleName] ASC
)WITH (PAD_INDEX = OFF, STATISTICS_NORECOMPUTE = OFF, SORT_IN_TEMPDB = OFF, DROP_EXISTING = OFF, ONLINE = OFF, ALLOW_ROW_LOCKS = ON, ALLOW_PAGE_LOCKS = ON, OPTIMIZE_FOR_SEQUENTIAL_KEY = OFF) ON [PRIMARY]
GO

CREATE NONCLUSTERED INDEX [IX_Person_LastName_FirstName_MiddleName_4] ON [Person].[Person]
(
[LastName] ASC,
[FirstName] ASC,
[MiddleName] ASC
)WITH (PAD_INDEX = OFF, STATISTICS_NORECOMPUTE = OFF, SORT_IN_TEMPDB = OFF, DROP_EXISTING = OFF, ONLINE = OFF, ALLOW_ROW_LOCKS = ON, ALLOW_PAGE_LOCKS = ON, OPTIMIZE_FOR_SEQUENTIAL_KEY = OFF) ON [PRIMARY]
GO

CREATE NONCLUSTERED INDEX [IX_Person_LastName_FirstName_MiddleName_5] ON [Person].[Person]
(
[LastName] ASC,
[FirstName] ASC,
[MiddleName] ASC
)WITH (PAD_INDEX = OFF, STATISTICS_NORECOMPUTE = OFF, SORT_IN_TEMPDB = OFF, DROP_EXISTING = OFF, ONLINE = OFF, ALLOW_ROW_LOCKS = ON, ALLOW_PAGE_LOCKS = ON, OPTIMIZE_FOR_SEQUENTIAL_KEY = OFF) ON [PRIMARY]
GO

As a side thought; wouldn't it be great if Clippy appeared and told me I already had an index with the same columns and that these weren't needed? It would be great, but SQL doesn't check for these things so the duplicate indexes get created straight with no fuss.

Now the first thing I wondered was if the optimiser would not use full optimisation because it has additional indexes to think about but no, looking at the Plan XML I see that a trivial plan has been used again: StatementOptmLevel="TRIVIAL". So what index has it used?


As we can see from the execution plan this time the optimiser has used the last index that I created; IX_Person_LastName_FirstName_MiddleName_5. Why? Well in all honesty I don't know, is it because the optimiser uses the very latest index by default. I'm not sure. But let's delete the index and see what happens:

DROP INDEX [IX_Person_LastName_FirstName_MiddleName_5] ON [Person].[Person]
GO

When I run the query it has again used the "latest" duplicate index:


I did wonder if it's in some way limited to trivial plans so I added a join to my query to give the optimiser something to think about and use full optimisation:

SELECT FirstName, LastName, MiddleName, b.BusinessEntityID 
FROM Person.Person p
INNER JOIN Person.BusinessEntity b ON p.BusinessEntityID = b.BusinessEntityID
WHERE FirstName = 'Allison' AND LastName = 'Stewart'
OPTION (RECOMPILE);

This time the Plan XML shows StatementOptmLevel="FULL" so the optimiser has had to do a bit of extra work, and if we look at the execution plan again we can see it's using the "latest" index again:


Now I'm going to have to do some more digging to see if the optimiser always uses the most recent or latest index, maybe it's default behaviour - if you know then please let me know!

And to clean things up I'll remove all those duplicate indexes before writing any more queries!

Monday, January 31, 2022

Things you shouldn't really do in SQL Server: Disabling Join Types Globally

A while ago I presented a session which covered transformation rules that are used by the query optimiser to produce our execution plans. I'm not feeling in the mood for relational algebra this morning so instead I'll introduce a command that can cause mayhem on an instance SQL Server: DBCC RULEOFF.

DBCC RULEOFF is an undocumented command, that alone makes me want to use it but in order to cover one's backside please don't do any of the following in any environment apart from a disposable sandbox that only you use for weird and wonderful experiments in SQL Server, because we are going to break it...

Let's take a simple query with a join:

SELECT e.BusinessEntityID, e.JobTitle, p.FirstName
FROM HumanResources.Employee e
INNER JOIN Person.Person p
ON e.BusinessEntityID = p.BusinessEntityID;

If I look at the estimated execution plan I can see that the optimiser has selected a nested loop join:


Now I could use the QUERYRULEOFF hint to disable that join for this particular query and for this particular join type I'd need two different hints to disable nested loop operators for the join:

OPTION (QUERYRULEOFF JNtoNL, QUERYRULEOFF JNtoIdxLookup);

This will force the optimiser to use a different join type and the estimated plan this time shows a hash match join but for this article we're not looking at QUERYRULEOFF, we're looking at DBCC RULEOFF which will still do the same thing only it's not for one query, it's for the entire instance.

MWAHAHAHAHAHAHA

That's right, running DBCC RULEOFF('JNtoNL') will essentially switch off the nested loop join for every single query running on my instance, well, sort of. After running the command I can check what rules are off on my instance by first running DBCC TRACEON(3604) to redirect DBCC output to my messages tab and then run DBCC SHOWOFFRULES:

Rules that are off globally:

JNtoNL

That's just one of the rules though, so just as when I used the query hint with without nested loop joins I'll also run DBCC RULEOFF('JNtoIdxLookup') to disable the other transformation rule that the optimiser can use for a nested loop join and verify again with DBCC SHOWOFFRULES. Now that they're both disabled the estimated plan looks a bit different and is using a hash match operator instead.

A different logical join type will not be affected. If I change the INNER JOIN to a LEFT JOIN and check the execution plan I will see a nested loop operator again.

SELECT e.BusinessEntityID, e.JobTitle, p.FirstName
FROM HumanResources.Employee e
LEFT JOIN Person.Person p
ON e.BusinessEntityID = p.BusinessEntityID;

This is how transformation rules work, essentially they are a substitution for a logical operation (INNER JOIN, LEFT JOIN etc) for a physical operation, that is the operator we see in the execution plan. So far we've only disabled the following rules JNtoNL and JNtoIdxLookup and they only affect the INNER JOIN logical operations. 

For left joins we'll need to switch off the corresponding transformation rules (LOJNtoNL and LeftSideJNtoIdxLookup) and when done we can see the same effect on the estimated execution plan as before where the optimiser has used a hash match join.

Now whilst I can make a case of disabling rules at a query level to check execution plans using different join types (or you could use join hints) I can't really make the same case for disabling them at an instance level. But this post is titled "Things you shouldn't really do..." so let's do something completely reckless.

If I run the following query I can see every transformation rule that contains 'JN' as in JOIN and I've also included the command to disable that rule:

SELECT [name], 'DBCC RULEOFF (''' + [name] + ''');' AS [DontDoIt!!!]
FROM sys.dm_exec_query_transformation_stats
WHERE [name] LIKE '%JN%';

For no other reason but for widespread chaos I can now disable every transformation rule that substitute joins by running each all of the commands returned by my query. Now things are so bad that if I try to run my query I get the following error:

Msg 8624, Level 16, State 1, Line 5
Internal Query Processor Error: The query processor could not produce a query plan. For more information, contact Customer Support Services.

I think that means it's broken, at least if I want to join any tables anyway!

So please, please, please don't do this. There's literally no reason to do so on any SQL system of any kind. I will put everything back by running the following so I can generate the commands to switch on all rules once again and verify with DBCC SHOWOFFRULES that nothing has remained disabled. 

SELECT [name], 'DBCC RULEON (''' + [name] + ''');' AS [DoIt!!!]
FROM sys.dm_exec_query_transformation_stats
WHERE [name] LIKE '%JN%';

Another reason why I stay well away from relational algebra.

SQL Server Management Studio: Database Reports - All Blocking Transactions

I've used SQL Server Management Studio for many years and whilst there's other options out there like Azure Data Studio, SQLCMD  or PowerShell it's mainly my go to option for doing stuff in SQL Server.

For most DBA I write T-SQL code; for example I haven't used Activity Monitor for a long time and instead prefer the use of Dynamic Management Objects to query out the bits of information that I need.  

But Management Studio does have some useful functionality in there. If I right click on a database, select Reports and Standard Reports I get a list of all kinds of different reports where I see what's 

I'll be honest, I've occasionally used the Disk Usage reports and apart from that I had no idea what else was in here so I've decided to look at the All Blocking Transactions report in action being that it's a fairly common monitoring task and in order to do that I'll run the following update statement in a transaction without committing it or rolling it back:

BEGIN TRAN

UPDATE Person.Person
SET FirstName = 'Dave'
WHERE FirstName = 'David' and LastName = 'Bartness';

When I run this code I will get a message saying that 1 row has been affected but as my transaction is still open my update has not been committed which means if I try to run a select query on that same table in another query window I will run into a classic case of blocking:

SELECT * FROM [AdventureWorks2019].[Person].[Person]

My select query is now in a bit of limbo, and in Management Studio I can see that it's stuck executing my query, now let's run the report:

In this report I am seeing the blocking transaction, often referred to as the header blocker. The Session ID is 62 which is my original update query and the report is showing that it's directly blocking one other transaction. 

In order to see what queries are being blocked I can expand the first column of the report, Transaction ID (in this case 151616) which returns the details of my blocked select statement:


Now as I mentioned earlier on in the post I don't often use Management Studio for much else other than writing queries. I've captured the query used by this particular report and it's, well here it is:

exec sp_executesql @stmt=N'begin try 

declare @tab_tran_locks as table( 
        database_id int   
,       l_resource_type nvarchar(60) collate database_default    
,       l_resource_subtype nvarchar(60) collate database_default
,       l_resource_associated_entity_id bigint   
,       l_blocking_request_spid int   
,       l_blocked_request_spid int   
,       l_blocking_request_mode nvarchar(60) collate database_default   
,       l_blocked_request_mode nvarchar(60) collate database_default   
,       l_blocking_tran_id bigint
,   l_blocked_tran_id bigint   
); 
declare @tab_blocked_tran as table (
        tran_id bigint 
,       no_blocked bigint
);  
declare @temp_tab table( 
        blocking_status int 
,       no_blocked int 
,       database_id int 
,       l_resource_type nvarchar(60) collate database_default  
,       l_resource_subtype nvarchar(60) collate database_default  
,   l_resource_associated_entity_id bigint 
,       l_blocking_request_spid int 
,       l_blocked_request_spid int
,       l_blocking_request_mode nvarchar(60) collate database_default 
,       l_blocked_request_mode nvarchar(60) collate database_default 
,       l_blocking_tran_id bigint
,   l_blocked_tran_id bigint
,   local1 int
,       local2 int
,       b_tran_id bigint
,       w_tran_id bigint
,       b_name nvarchar(128) collate database_default 
,       w_name nvarchar(128) collate database_default 
,       b_tran_begin_time datetime
,       w_tran_begin_time datetime
,       b_state nvarchar(60) collate database_default 
,       w_state nvarchar(60) collate database_default 
,       b_trans_type nvarchar(60) collate database_default 
,       w_trans_type nvarchar(60) collate database_default 
,       b_text nvarchar(max) collate database_default 
,       w_text nvarchar(max) collate database_default 
,       db_span_count1 int
,       db_span_count2 int 
);
insert into @tab_tran_locks 
select                          
        a.resource_database_id
,       a.resource_type
,       a.resource_subtype
,       a.resource_associated_entity_id
,       a.request_session_id as blocking 
,       b.request_session_id as blocked
,       a.request_mode
,       b.request_mode
,       a.request_owner_id
,       b.request_owner_id   
from sys.dm_tran_locks a 
join sys.dm_tran_locks b on   (a.resource_type = b.resource_type and a.resource_subtype = b.resource_subtype and a.resource_associated_entity_id = b.resource_associated_entity_id and a.resource_description = b.resource_description)  
where (a.request_status = ''GRANT'' and (b.request_status = ''WAIT'' or b.request_status = ''CONVERT'')) and a.request_owner_type = ''TRANSACTION'' and b.request_owner_type = ''TRANSACTION'';

insert into @tab_blocked_tran  
select ttl.l_blocking_tran_id
,       count(distinct ttl.l_blocked_tran_id) 
from @tab_tran_locks ttl   
group by ttl.l_blocking_tran_id 
order by count( distinct ttl.l_blocked_tran_id) desc 

insert into @temp_tab  
select  0 as blocking_status
,       tbt.no_blocked
,       ttl.*
,       st1.is_local as local1
,       st2.is_local as local2
,       st1.transaction_id as b_tran_id
,       ttl.l_blocked_tran_id as w_tran_id
,       at1.name as b_name
,       at2.name as w_name
,       at1.transaction_begin_time as b_tran_begin_time
,       at2.transaction_begin_time as w_tran_begin_time
,       case when at1.transaction_type <> 4 
                 then case at1.transaction_state 
                                when 0 then ''Invalid''
                                when 1 then ''Initialized''
                                when 2 then ''Active''
                                when 3 then ''Ended''
                                when 4 then ''Commit Started''
                                when 5 then ''Prepared''
                                when 6 then ''Committed''
                                when 7 then ''Rolling Back''
                                when 8 then ''Rolled Back''
                        end 
                 else case at1.dtc_state 
                                when 1 then ''Active''
                                when 2 then ''Prepared''
                                when 3 then ''Committed''
                                when 4 then ''Aborted''
                                when 5 then ''Recovered''
                        end 
        end b_state
,       case when at2.transaction_type <> 4 
                then case at2.transaction_state 
                                when 0 then ''Invalid''
                                when 1 then ''Initialized''
                                when 2 then ''Active''
                                when 3 then ''Ended''
                                when 4 then ''Commit Started''
                                when 5 then ''Prepared''
                                when 6 then ''Committed''
                                when 7 then ''Rolling Back''
                                when 8 then ''Rolled Back''
                        end 
                 else case at1.dtc_state 
                                when 1 then ''Active''
                                when 2 then ''Prepared''
                                when 3 then ''Committed''
                                when 4 then ''Aborted''
                                when 5 then ''Recovered''
                        end 
        end w_state
,       at1.transaction_type as b_trans_type
,               at2.transaction_type  as w_trans_type
,       case when r1.sql_handle IS NULL then ''--'' else ( select top 1 substring(text,(r1.statement_start_offset+2)/2, (case when r1.statement_end_offset = -1   then (len(convert(nvarchar(MAX),text))*2) else r1.statement_end_offset  end - r1.statement_start_offset) /2  ) from sys.dm_exec_sql_text(r1.sql_handle)) end as b_text
,       case when r2.sql_handle IS NULL then ''--'' else ( select top 1 substring(text,(r2.statement_start_offset+2)/2, (case when r2.statement_end_offset =-1 then len(convert(nvarchar(MAX),text))*2  when r2.statement_end_offset =0  then len(convert(nvarchar(MAX),text))*2  else r2.statement_end_offset  end - r2.statement_start_offset) /2  ) from sys.dm_exec_sql_text(r2.sql_handle)) end as w_text 
,       ( Select count(distinct database_id) from sys.dm_tran_database_transactions where transaction_id = st1.transaction_id ) as db_span_count1
,       ( Select count(distinct database_id) from sys.dm_tran_database_transactions where transaction_id = st2.transaction_id ) as db_span_count2  
from @tab_tran_locks ttl 
inner join sys.dm_tran_active_transactions at1 on(at1.transaction_id = ttl.l_blocking_tran_id) 
inner join @tab_blocked_tran tbt on(tbt.tran_id = at1.transaction_id)  
inner join sys.dm_tran_session_transactions st1 on(at1.transaction_id = st1.transaction_id) 
left outer join sys.dm_exec_requests r1 on(at1.transaction_id = r1.transaction_id ) 
inner join sys.dm_tran_active_transactions at2 on(at2.transaction_id = ttl.l_blocked_tran_id) 
left outer join sys.dm_tran_session_transactions st2  on(at2.transaction_id = st2.transaction_id)  
left outer join  sys.dm_exec_requests r2 on(at2.transaction_id = r2.transaction_id ) 
where st1.is_user_transaction = 1
order by tbt.no_blocked desc;

declare @db_blocking_tab table (
        database_id int
,       blocking_status int
,       no_blocked int
,       total_blocked int
,       l_resource_type nvarchar(60) collate database_default 
,       l_resource_subtype nvarchar(60) collate database_default 
,       l_resource_associated_entity_id bigint
,       l_blocking_request_spid int
,       l_blocked_request_spid int
,       l_blocking_request_mode nvarchar(60) collate database_default 
,       l_blocked_request_mode nvarchar(60) collate database_default 
,       local1 int
,       local2 int
,       b_tran_id bigint
,       w_tran_id bigint
,       b_name nvarchar(128) collate database_default 
,       w_name nvarchar(128) collate database_default 
,       b_tran_begin_time datetime
,       w_tran_begin_time datetime
,       b_state nvarchar(60) collate database_default 
,       w_state nvarchar(60) collate database_default 
,       b_trans_type nvarchar(60) collate database_default 
,       w_trans_type nvarchar(60) collate database_default 
,       b_text nvarchar(max) collate database_default 
,       w_text nvarchar(max) collate database_default 
,       db_span_count1 int
,       db_span_count2 int
,       lvl int
); 

declare @b_tran_id_tab table (  tran_id bigint);

WITH Blocking(
        database_id
,       blocking_status
,       no_blocked
,       total_blocked
,       l_resource_type
,       l_resource_subtype
,       l_resource_associated_entity_id
,       l_blocking_request_spid
,       l_blocked_request_spid
,       l_blocking_request_mode
,       l_blocked_request_mode
,       local1
,       local2
,       b_tran_id
,       w_tran_id
,       b_name
,       w_name
,       b_tran_begin_time
,       w_tran_begin_time
,       b_state
,       w_state
,       b_trans_type
,       w_trans_type
,       b_text
,       w_text
,       db_span_count1
,       db_span_count2
,       lvl)  
AS ( SELECT 
        database_id
,       blocking_status
,       no_blocked
,   no_blocked
,       l_resource_type
,       l_resource_subtype
,       l_resource_associated_entity_id
,       l_blocking_request_spid
,       l_blocked_request_spid
,       l_blocking_request_mode
,       l_blocked_request_mode
,       local1
,       local2
,       b_tran_id
,       w_tran_id
,       b_name
,       w_name
,       b_tran_begin_time
,       w_tran_begin_time
,       b_state
,       w_state
,       b_trans_type
,       w_trans_type
,       b_text
,       w_text
,       db_span_count1
,       db_span_count2
,       0       
from @temp_tab          
UNION ALL       
SELECT E.database_id
,       E.blocking_status
,       M.no_blocked
,       convert(int,E.no_blocked + total_blocked)
,       E.l_resource_type
,       E.l_resource_subtype
,       E.l_resource_associated_entity_id
,       M.l_blocking_request_spid
,       E.l_blocked_request_spid
,       M.l_blocking_request_mode
,       E.l_blocked_request_mode
,       M.local1
,       E.local2
,       M.b_tran_id
,       E.w_tran_id
,       M.b_name
,       E.w_name
,       M.b_tran_begin_time
,       E.w_tran_begin_time
,       M.b_state
,       E.w_state
,       M.b_trans_type
,       E.w_trans_type
,       M.b_text
,       E.w_text
,       M.db_span_count1
,       E.db_span_count2
,       M.lvl+1         
from @temp_tab AS E                     
JOIN Blocking AS M ON E.b_tran_id = M.w_tran_id )  

insert into @db_blocking_tab 
select * from Blocking  

insert into @b_tran_id_tab 
select top 20 b_tran_id from @db_blocking_tab 
where database_id = db_id() group by b_tran_id order by max(total_blocked) desc ; 

select  (dense_rank() over (order by dbt.no_blocked desc,dbt.b_tran_id))%2 as l1 
,       (dense_rank() over (order by dbt.no_blocked desc,dbt.b_tran_id,dbt.w_tran_id))%2 as l2
,       dbt.* 
from @b_tran_id_tab btid 
left outer join @db_blocking_tab dbt on (btid.tran_id = dbt.b_tran_id)  
order by dbt.no_blocked desc, dbt.b_tran_id,dbt.w_tran_id  
end try 
begin catch 
select -100 as l1
,       ERROR_NUMBER() as l2
,       ERROR_SEVERITY() as blocking_status
,       ERROR_STATE() as no_blocked
,       ERROR_MESSAGE() as total_blocked
,       1 as l_resource_type,1 as l_resource_subtype,1 as l_resource_associated_entity_id,1 as l_blocking_request_spid,1 as l_blocked_request_spid,1 as l_blocking_request_mode,1 as l_blocked_request_mode,1 as local1,1 as local2,1 as b_tran_id,1 as w_tran_id,1 as b_name,1 as w_name,1 as b_tran_begin_time,1 as w_tran_begin_time,1 as b_state,1 as w_state,1 as b_trans_type,1 as w_trans_type,1 as b_text,1 as w_text,1 as db_span_count1,1 as db_span_count2,1 as lvl 
end catch',@params=N''

That's a pretty big query and whilst it does return some useful query level information I can't see other information such as the login details or the host name of the blocked/blocking queries that I might need to determine who to blame, sorry I mean take the appropriate course of action for resolving the blocking problems. 

So is there a better way? 

Well in my opinion, absolutely yes! 

I could use a third party script such as sp_whoisactive or this one from Pinal Dave both of which I can honestly say I use all of the time when investigating blocking, but I also encourage people to spend time looking into SQL's Dynamic Management Objects and the DMV's such as sys.dm_exec_requests and sys.dm_tran_locks, both of which are used in the query from the All Blocking Transactions report above. It's a great way to start peeking into the internals of SQL Server and working with their information to create custom scripts for monitoring and diagnosing problems.

Index Column Order

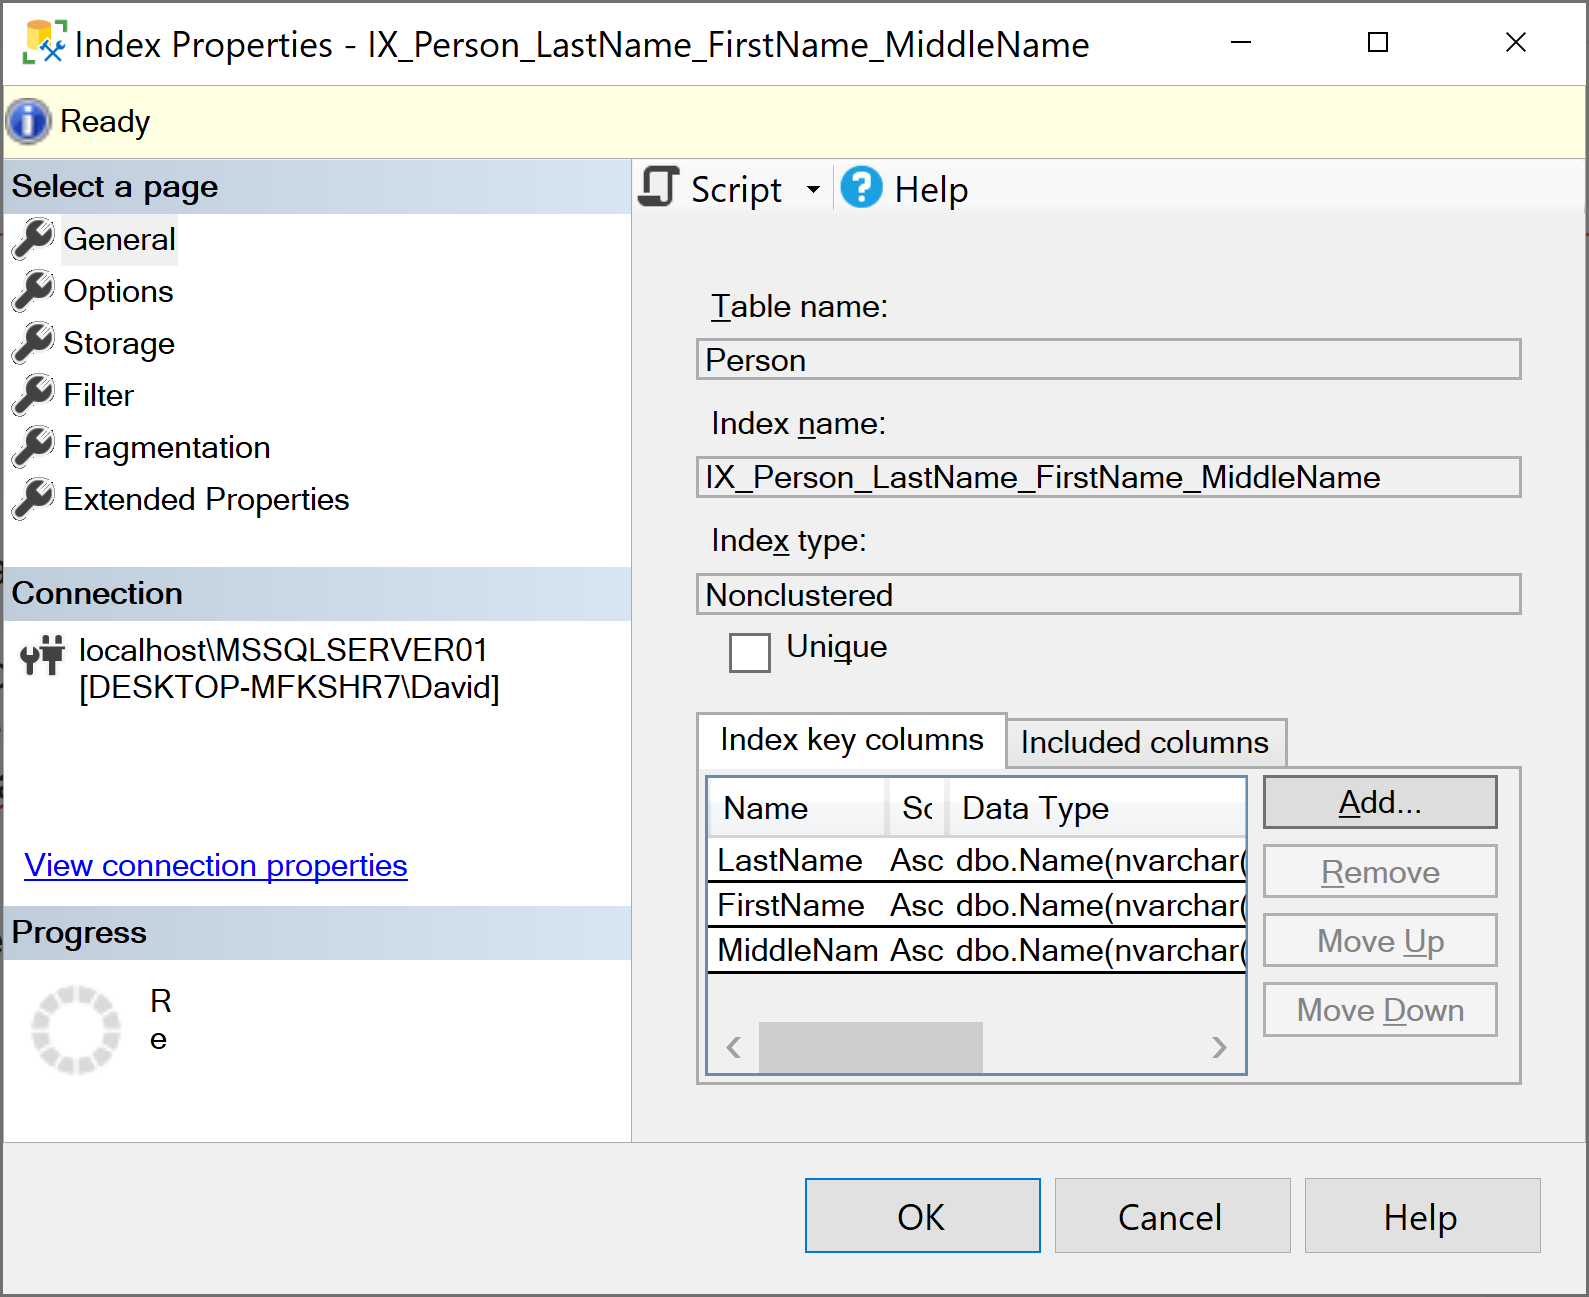
In this post I'm going to demonstrate one of the important factors of index design, the index column order. I'm going to be using the AdventureWorks2019 sample database and we'll take a look at the IX_Person_LastName_FirstName_MiddleName non-clustered index which is on the Person.Person table.

By looking at the index properties in Management Studio I can see the columns that make up the index and they have been put in the column order of LastName, FirstName and MiddleName. It's also worth noting the name of the index matches perfectly with the columns and their order which is a great example of a great naming convention!  


So how does the column order affect our queries? Let's start with the following query:

SELECT FirstName, LastName FROM Person.Person
WHERE LastName = 'Stewart';

Here we're selecting the FirstName and LastName columns from the Person.Person table where the LastName is 'Stewart', which is commonly referred to as filtering the rows. If I run the query it returns 93 rows and if I look at the execution plan (or query plan as it is also known) I can see that the optimiser has used an index seek operator on the IX_Person_LastName_FirstName_MiddleName index:

Now we'll try another query and change the WHERE clause to return rows, 87 in this example, where the FirstName = 'David' (because it's a great name):

SELECT FirstName, LastName FROM Person.Person
WHERE FirstName = 'David';

Although FirstName is present in our index as the second column our query plan is a little bit different this time:

Although we can see the optimiser is still using our index the optimiser has decided to use an index scan operator instead this time. In order to understand why this is different we have to look into not the rows returned by the engine (in this case 99) but the number of rows the engine has had to read to return those rows:

In Plan Explorer I can see that the engine has had to read through 19972 rows to return 87 however our first query that utilised the index seek operator has only had to read through 93 rows (and returned the same number):

Its also worth noting that for our index scan query we also see a Reason for Early Termination: Good Enough Plan Found which means the optimiser has retrieved the execution plan from cache, we don't see this message for the plan using an index seek as the optimiser has used a Trivial Plan instead.

This shows how a column cannot be effectively used for filtering (using the where clause in our query) unless it is the first column in an index. In the second query the index has still been used by the optimiser but it is unable to perform a more efficient seek operation and instead has had to scan (or read) through the entire index to return our results.

Now we could create an additional non-clustered index that has the FirstName column as the first column but we also have to determine the suitability of that index. If we were to create indexes for every single query on our database we'd end up with a lot of surplus indexes that are barley used which will inevitably cause a lot of overhead for things like table update operations and index maintenance. 

It's much more likely for queries to be filtering on LastName so that's a perfect candidate for a non-clustered index, if we're never going to use the FirstName column in where clauses, joins etc then an index using that column isn't goign to provide any benefit which is why understanding how the columns will be used in our queries is the most important factor in designing index strategies.

Wednesday, January 26, 2022

Query Simplification: Join Removal with Foreign Keys

Foreign keys are used in database design to enforce referential integrity but they also have some performance benefits as well that you might not necessarily notice unless you're looking into your execution plans.

Let's take the following query using the AdventureWorks2019 sample database where I'm selecting the BusinessEntityID and JobTitle from the HumanResources.Employee table and by using an inner join I'm only returning rows that have matching values (BusinessEntityID) in both tables:

SELECT e.BusinessEntityID, e.JobTitle
FROM HumanResources.Employee e
INNER JOIN Person.Person p 
ON e.BusinessEntityID = p.BusinessEntityID;

I might expect to see an operator that performs the inner join in the execution plan but when I look at the plan this is what I get:

Plan 1: Index Scan on HumanResources.Empoyee


Despite my query containing a join to the Person.Person table the optimiser has used an execution plan that only contains a clustered index scan of the HumanResources.Employee table. Even though the join is there in our query text it hasn't been used in the plan at all.

The reason why the join isn't present in our first query is partly down to the columns which the query is returning. I'm only selecting two columns which are both from the employee table, if I were to add a column from the Person.Person table such as in the following query then I will get a very different execution plan:

SELECT e.BusinessEntityID, e.JobTitle, p.FirstName
FROM HumanResources.Employee e
INNER JOIN Person.Person p 
ON e.BusinessEntityID = p.BusinessEntityID;


Plan 2: Query with column from Person.Person

By adding this column (or indeed any column from the Person.Person table or even worse if I had used SELECT *) the execution plan has two additional operators; an index seek on the Person.Person table and this time a join operator (Nested Loop) is present in the plan. This is also a great example of why only selecting columns that you actually need in a query is really important otherwise you might be causing needless overhead.

The column selection has clearly influenced the optimisers plan selection and when referencing columns in the Person.Person table in the select the optimiser has had to come up with a plan containing the join, but why for our first query has it not done the same thing? 

In this example the join removal is made possible due to a foreign key relationship between the two tables on the BusinessEntityID column. Which if you're playing along in Management Studio you can see under the HumanResources.Employee table under keys (FK_Employee_Person_BusinessEntityID).

As our inner join is essentially returning matching values from both tables and the foreign key exists on those the values the optimiser already knows that the values are matched and in turn as we're not returning any values from the Person.Person table it can avoid the cost of the join and the scan operation on the Person.Person table altogether, but we'll still get the same results.

In order to test this I'm going to remove the foreign key with the following T-SQL and then re-run the first query:

ALTER TABLE [HumanResources].[Employee] DROP CONSTRAINT [FK_Employee_Person_BusinessEntityID]
GO

SELECT e.BusinessEntityID, e.JobTitle
FROM HumanResources.Employee e
INNER JOIN Person.Person p 
ON e.BusinessEntityID = p.BusinessEntityID;

This time although we're only selecting records from the employee table we get a very different query plan that is unable to take advantage of join removal and as such has to perform an index scan on both tables which are joined using the Hash Match operator. 

Plan 3: Query with no foreign key


Before I carry on I'll add the foreign key back with the following T-SQL:

ALTER TABLE [HumanResources].[Employee]  WITH CHECK ADD  CONSTRAINT [FK_Employee_Person_BusinessEntityID] FOREIGN KEY([BusinessEntityID])
REFERENCES [Person].[Person] ([BusinessEntityID])
GO

ALTER TABLE [HumanResources].[Employee] CHECK CONSTRAINT [FK_Employee_Person_BusinessEntityID]
GO

This is a great example of how foreign keys not only force referential integrity but they do have some less obvious performance benefits too that the optimiser can take advantage during query optimisation phases. 

Breaking up with SQL Server

I was inspired to write this after reading a post from Dave Mason regarding breaking up with Big Tech companies. Yet again I haven't wr...