One of the first Dynamic Management Views I started using as a DBA is sys.dm_os_wait_stats which shows the cumulative wait times for our SQL Server instance. This information can be really useful but there are a couple of potential issues with using this DMV for troubleshooting.
The first problem is that there are so many wait types and many of these occur quite normally and don't often indicate any sort of problem whatsoever and should be ignored from any query on the DMV.
Being cumulative the values are added from the last time an instance was restarted or when the wait statistics were cleared, if neither of those has happened for a long time then the information could easily be very misleading and even mask issues completely.
In this post I'm going to demonstrate another problem with querying the cumulative wait information in this DMV which is all down to how, or rather when the wait information is gathered and available.
First of all I'm going to clear my sys.dm_os_wait_stats down by running the following command:
DBCC SQLPERF('sys.dm_os_wait_stats',CLEAR)
Once ran I'm just going to run a quick select query on my super imaginative test table:
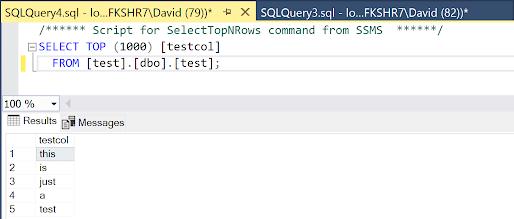
In order to create a suitable test scenario I'm going to cause some blocking within SQL Server by starting a transaction on my test table without committing or rolling it back and when I execute the query I receive the message telling me 1 row has been affected so it looks like the query has finished:

However the transaction is now in a sort of limbo land waiting for me to commit it or roll it back. Now I'm going to re-run my previous select statement and whilst the query starts I can see from the tab that it is "stuck" executing:

What is actually happening here is my update statement which is still in an open transaction is blocking my select statement. This is because by default SQL Server will only let me query and read committed rows so until my update transaction is completed the select won't finish either.
Now I'm going to check the wait statistics of my instance and to narrow things down a little I'm going to just look for wait types starting LCK that are to do with blocking and as you can see from the image below there are no waiting task counts or wait times associated with any blocking, which is untrue because we can see the tab is still showing as executing:

I'll now go back to my update statement and roll it back using ROLLBACK TRAN and when I do my select statement that was stuck executing will immediately return the result (which would occur whether I rollback or commit). When I rerun my wait stats query I know see the top wait LCK_M_S with a wait_time_ms of 649138.

As well as been a cumulative value the sys.dm_os_wait_stats DMV, and to quote the official description: "Returns information about all the waits encountered by threads that executed." It states threads that executed, not that are currently executing/waiting.
Whilst sys.dm_os_wait_stats can give us a good indication of how a server has been performing overall for real time troubleshooting it may not be the right level of diagnosis that we need and instead of looking at cumulative server wait statistics we need to go a little deeper into the task layer to get a much better picture of what is happening at that moment and we'll cover that in a forthcoming post!
No comments:
Post a Comment