Friday, February 26, 2021

Spark on Ubuntu (WSL) : Installing PySpark


This is a quick post to go over the install process for running PySpark on an Ubuntu terminal environment running on the Windows (WSL, Windows Subsystem for Linux). How times have changed! 

Links for both the Ubuntu Terminal and Apache Spark::

DOWNLOAD SPARK: Downloads | Apache Spark (I moved the downloaded tgz file to a local folder C:\spark)

DOWNLOAD UBUNTU TERMINAL FOR WINDOWS 10 WSL | Ubuntu

The post won't cover any instructions for installing Ubuntu and instead I'll assume you've installed already and downloaded the tgz file from the Apache Spark download page (Step 3 in the above link).

Let's go straight into the terminal window and get going! I've put the commands in bold text (don't include the $) just so anyone can see a bit easier and who also prefers to ignore my jibberish! 

$ dir is a very familiar command however running at this point returned absolutely nothing! I was expecting at least some file or folder listings and attempting to change directory to my Spark folder on my local C drive returned a no such file or directory error.

In Linux land the C:\ drive is actually mounted a little different so from my command prompt I had enter the following command instead to get to the right folder:

$ cd /mnt/c/spark

Now I can extract my downloaded tgz (tarball) file

$ tar -xf spark-3.0.2-bin-hadoop2.7.tgz

HOWEVER, straight away errors saying: Cannot utime: Operation not permitted which was resolved by redoing the above command with good old sudo: 

$ sudo tar -xf spark-3.0.2-bin-hadoop2.7.tgz which will prompt me for the password when Ubuntu was first installed and now the tarball contents are successfully extracted (you can run dir again just to be sure!) and cd to the folder:

$ cd spark-3.0.2-bin-hadoop2.7

Now we need to install the shell which we'll use with Spark (Python, Scala, SQL or R) in this case I opted for Python and in order to do that cd to the bin folder using cd bin and run pyspark 

Which promptly didn't run and instead returned the error pyspark: command not found.

Even though with a dir command I could see pyspark, pyspark.cmd etc it would not run and that's because I needed to slightly the command to ./pyspark which although worked (YES!) gave a different error message: JAVA_HOME not set (BOO!!!). 

Rubbish, but in this case it's simply because Java is not installed which is fixed by the following command to get it installed:

$ sudo apt install default-jre

Now that Java is installed you'd think we'd be there by now but no, running ./pyspark gave yet another error, this time it's: env: 'python': No such file or directory so we need one last command to set the environment variable properly: 

$ export PYSPARK_PYTHON=python3 (to set just for this session)

And finally, we have PySpark (our Spark Shell) running locally and ready to go!


Sunday, February 21, 2021

Problems using sys.dm_os_wait_stats for troubleshooting

One of the first Dynamic Management Views I started using as a DBA is sys.dm_os_wait_stats which shows the cumulative wait times for our SQL Server instance. This information can be really useful but there are a couple of potential issues with using this DMV for troubleshooting.

The first problem is that there are so many wait types and many of these occur quite normally and don't often indicate any sort of problem whatsoever and should be ignored from any query on the DMV.

Being cumulative the values are added from the last time an instance was restarted or when the wait statistics were cleared, if neither of those has happened for a long time then the information could easily be very misleading and even mask issues completely.

In this post I'm going to demonstrate another problem with querying the cumulative wait information in this DMV which is all down to how, or rather when the wait information is gathered and available.

First of all I'm going to clear my sys.dm_os_wait_stats down by running the following command:

DBCC SQLPERF('sys.dm_os_wait_stats',CLEAR)

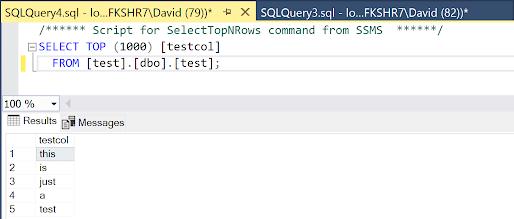
Once ran I'm just going to run a quick select query on my super imaginative test table: 


In order to create a suitable test scenario I'm going to cause some blocking within SQL Server by starting a transaction on my test table without committing or rolling it back and when I execute the query I receive the message telling me 1 row has been affected so it looks like the query has finished:


However the transaction is now in a sort of limbo land waiting for me to commit it or roll it back. Now I'm going to re-run my previous select statement and whilst the query starts I can see from the tab that it is "stuck" executing:


What is actually happening here is my update statement which is still in an open transaction is blocking my select statement. This is because by default SQL Server will only let me query and read committed rows so until my update transaction is completed the select won't finish either.

Now I'm going to check the wait statistics of my instance and to narrow things down a little I'm going to just look for wait types starting LCK that are to do with blocking and as you can see from the image below there are no waiting task counts or wait times associated with any blocking, which is untrue because we can see the tab is still showing as executing:


I'll now go back to my update statement and roll it back using ROLLBACK TRAN and when I do my select statement that was stuck executing will immediately return the result (which would occur whether I rollback or commit). When I rerun my wait stats query I know see the top wait LCK_M_S with a wait_time_ms of 649138.


As well as been a cumulative value the sys.dm_os_wait_stats DMV, and to quote the official description: "Returns information about all the waits encountered by threads that executed." It states threads that executed, not that are currently executing/waiting.

Whilst sys.dm_os_wait_stats can give us a good indication of how a server has been performing overall for real time troubleshooting it may not be the right level of diagnosis that we need and instead of looking at cumulative server wait statistics we need to go a little deeper into the task layer to get a much better picture of what is happening at that moment and we'll cover that in a forthcoming post!

Saturday, February 20, 2021

(NON-SERIOUS) The Not So Pro Guide to SQL Server Wait Statistics

The following guide to SQL Server wait statistics (as seen in the sys.dm_os_wait_stats DMV) is complete jibberish. It should not be taken seriously under any circumstances and if followed on a production environment don't mention my name. In fact blame Derek.

Please!! DO NOT DO any of this, it's a joke (it's barely that to be fair).


ASYNC_NETWORK_IO

Asynchronously blame the network and storage teams for not upping their game. 

CXPACKET

Attempt to pronounce parallellellellellism correctly then set MAXDOP to 1.

PAGELATCH

Mention TempDB and contention in the same sentence. Delete TempDB

BACKUP_

Delete any long running backup jobs. If wait persists then delete all backup jobs.

PAGEIOLATCH

Point menacingly at storage team, shout IO and YOUR FAULT a lot. Double server RAM when nobody is looking and set SQL Server Max Memory to 2147483647.

LCK_

Well documented issue that is only truly resolved by adding NOLOCK to all queries. Often a less seasoned SQL Server professional will try to advise that this is bad practice. Smile politely, tell them they're too pessimistic and ignore them. Send an email welcoming all stakeholders to the turbo times.

HADR_

Migrate all currently implemented HADR solutions to use merge replication.

IO_COMPLETION

Databases are way too big, shrink them. Occasionally databases won't shrink, this is a known issue that can be resolved by removing all indexes.

DATABASE MIRRORING_

See HADR_ wait

PREEMPTIVE_OLEDBOPS

It's not a wait type, it's a movement. 

OLEDB

Someone has set the OLE database to single user mode or in business critical conditions the OLE database does not exist and urgently requires adding to the instance.

SOS_SCHEDULER_YIELD

Very common wait type indicating that available CPU resource is lame. Immediately quadruple the current amount of CPU's. If using enterprise edition then double again to maximise gains.

MSQL_XP

Non valid wait. Your stored procedures are so awesome they've been awarded XP points.

PWAIT_GWPROXYCONN_PENDINGQUEUE_RWLOCK

Install Welsh language pack.

QDS_HOST_INIT

Clearly it's the QDS host, innit. 

RESOURCE_SEMAPHORE

Widely considered as the too much hassle wait. Tell anyone that asks that you recently read online that memory grants are particularly slow at this time of year and it should pick up in the summer when you migrate to the cloud.

CXCONSUMER

Well documented bug in SQL Server 2017; install Service Pack 33.

THREADPOOL

Check max worker threads for default value of 0 and promptly set to 1.

TESTTHREAD

Locate whoever is testing in production and tell them to stop, unless it's cursors.

WRITELOG

Set all databases to simple recovery. Stop SQL Server and delete all transaction log files as you don't them anymore. 

SLEEP TASK

AKA the wakey wakey wait, schedule a restart of SQL Server during the next team meeting.

Breaking up with SQL Server

I was inspired to write this after reading a post from Dave Mason regarding breaking up with Big Tech companies. Yet again I haven't wr...